visual model design
Build constructs and structural paths on an interactive canvas, then keep coefficients and model outputs connected to the diagram that produced them.
Build, analyse, and report PLS-SEM models through a focused desktop workflow designed for researchers.
metis connects the visual model, your dataset, the seminr engine, and the results flow in one readable desktop environment.
metis is a free desktop application for researchers and students who need a serious PLS-SEM workflow without expensive licences. It combines a visual modelling canvas with the R and seminr analysis engine so you can move from theory to interpretable results in one place.
Build constructs and structural paths on an interactive canvas, then keep coefficients and model outputs connected to the diagram that produced them.
Run PLS-SEM, faster bootstrap defaults, PLS predict, and higher-order construct workflows with practical control over subsamples, weighting schemes, and iterations.
Use seminr-powered statistics without writing R code. metis handles the backend pipeline while you stay focused on theory and interpretation.
Your dataset and calculations stay on your machine. metis runs the analysis engine locally, with no cloud upload requirement.
metis keeps path coefficients, loadings, and fit indices close to the model that produced them, so the structure and the interpretation stay aligned.
Import your dataset and design with real indicator names, real loadings, and real significance values from the first run onward.
metis handles bootstrapping, PLS predict, NCA, cIPMA, IPMA, and the seminr setup work for you, so you can focus on specification, interpretation, and reporting.
The R engine runs on localhost only. No account required, no telemetry, no cloud. Your research data stays yours.
Choose your target workspace, saved PLS-SEM model, and set custom report titles.
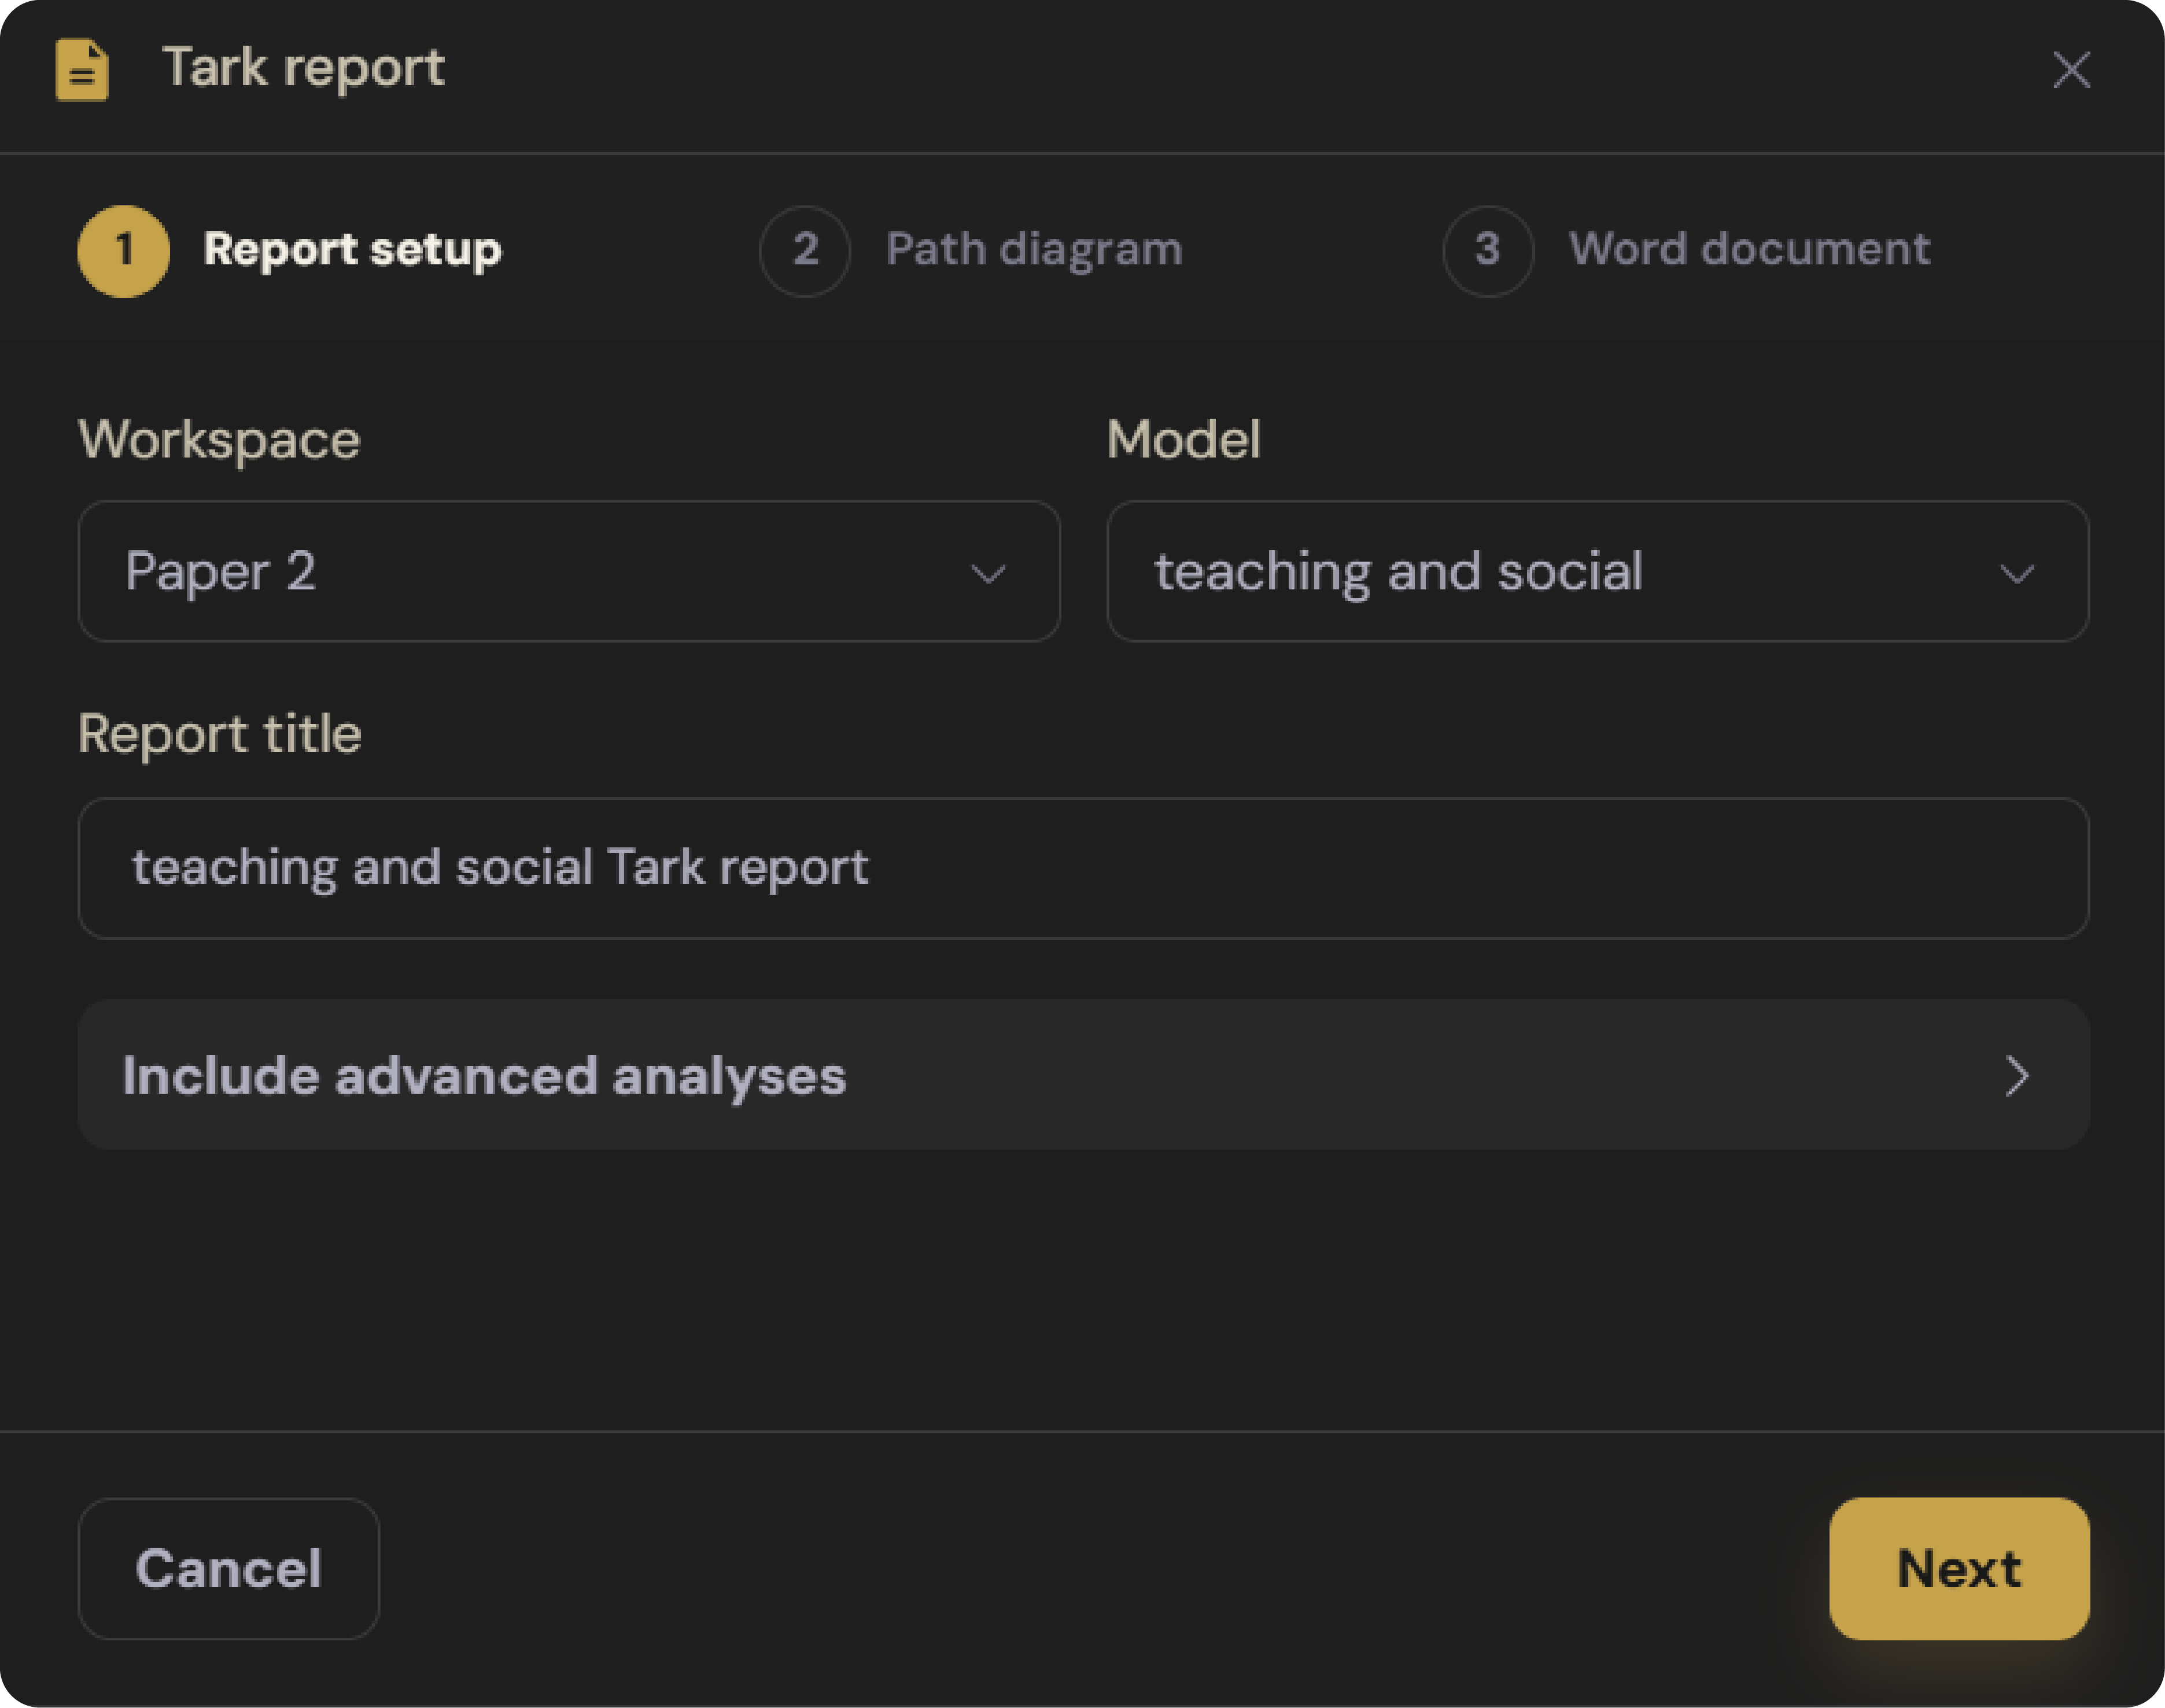
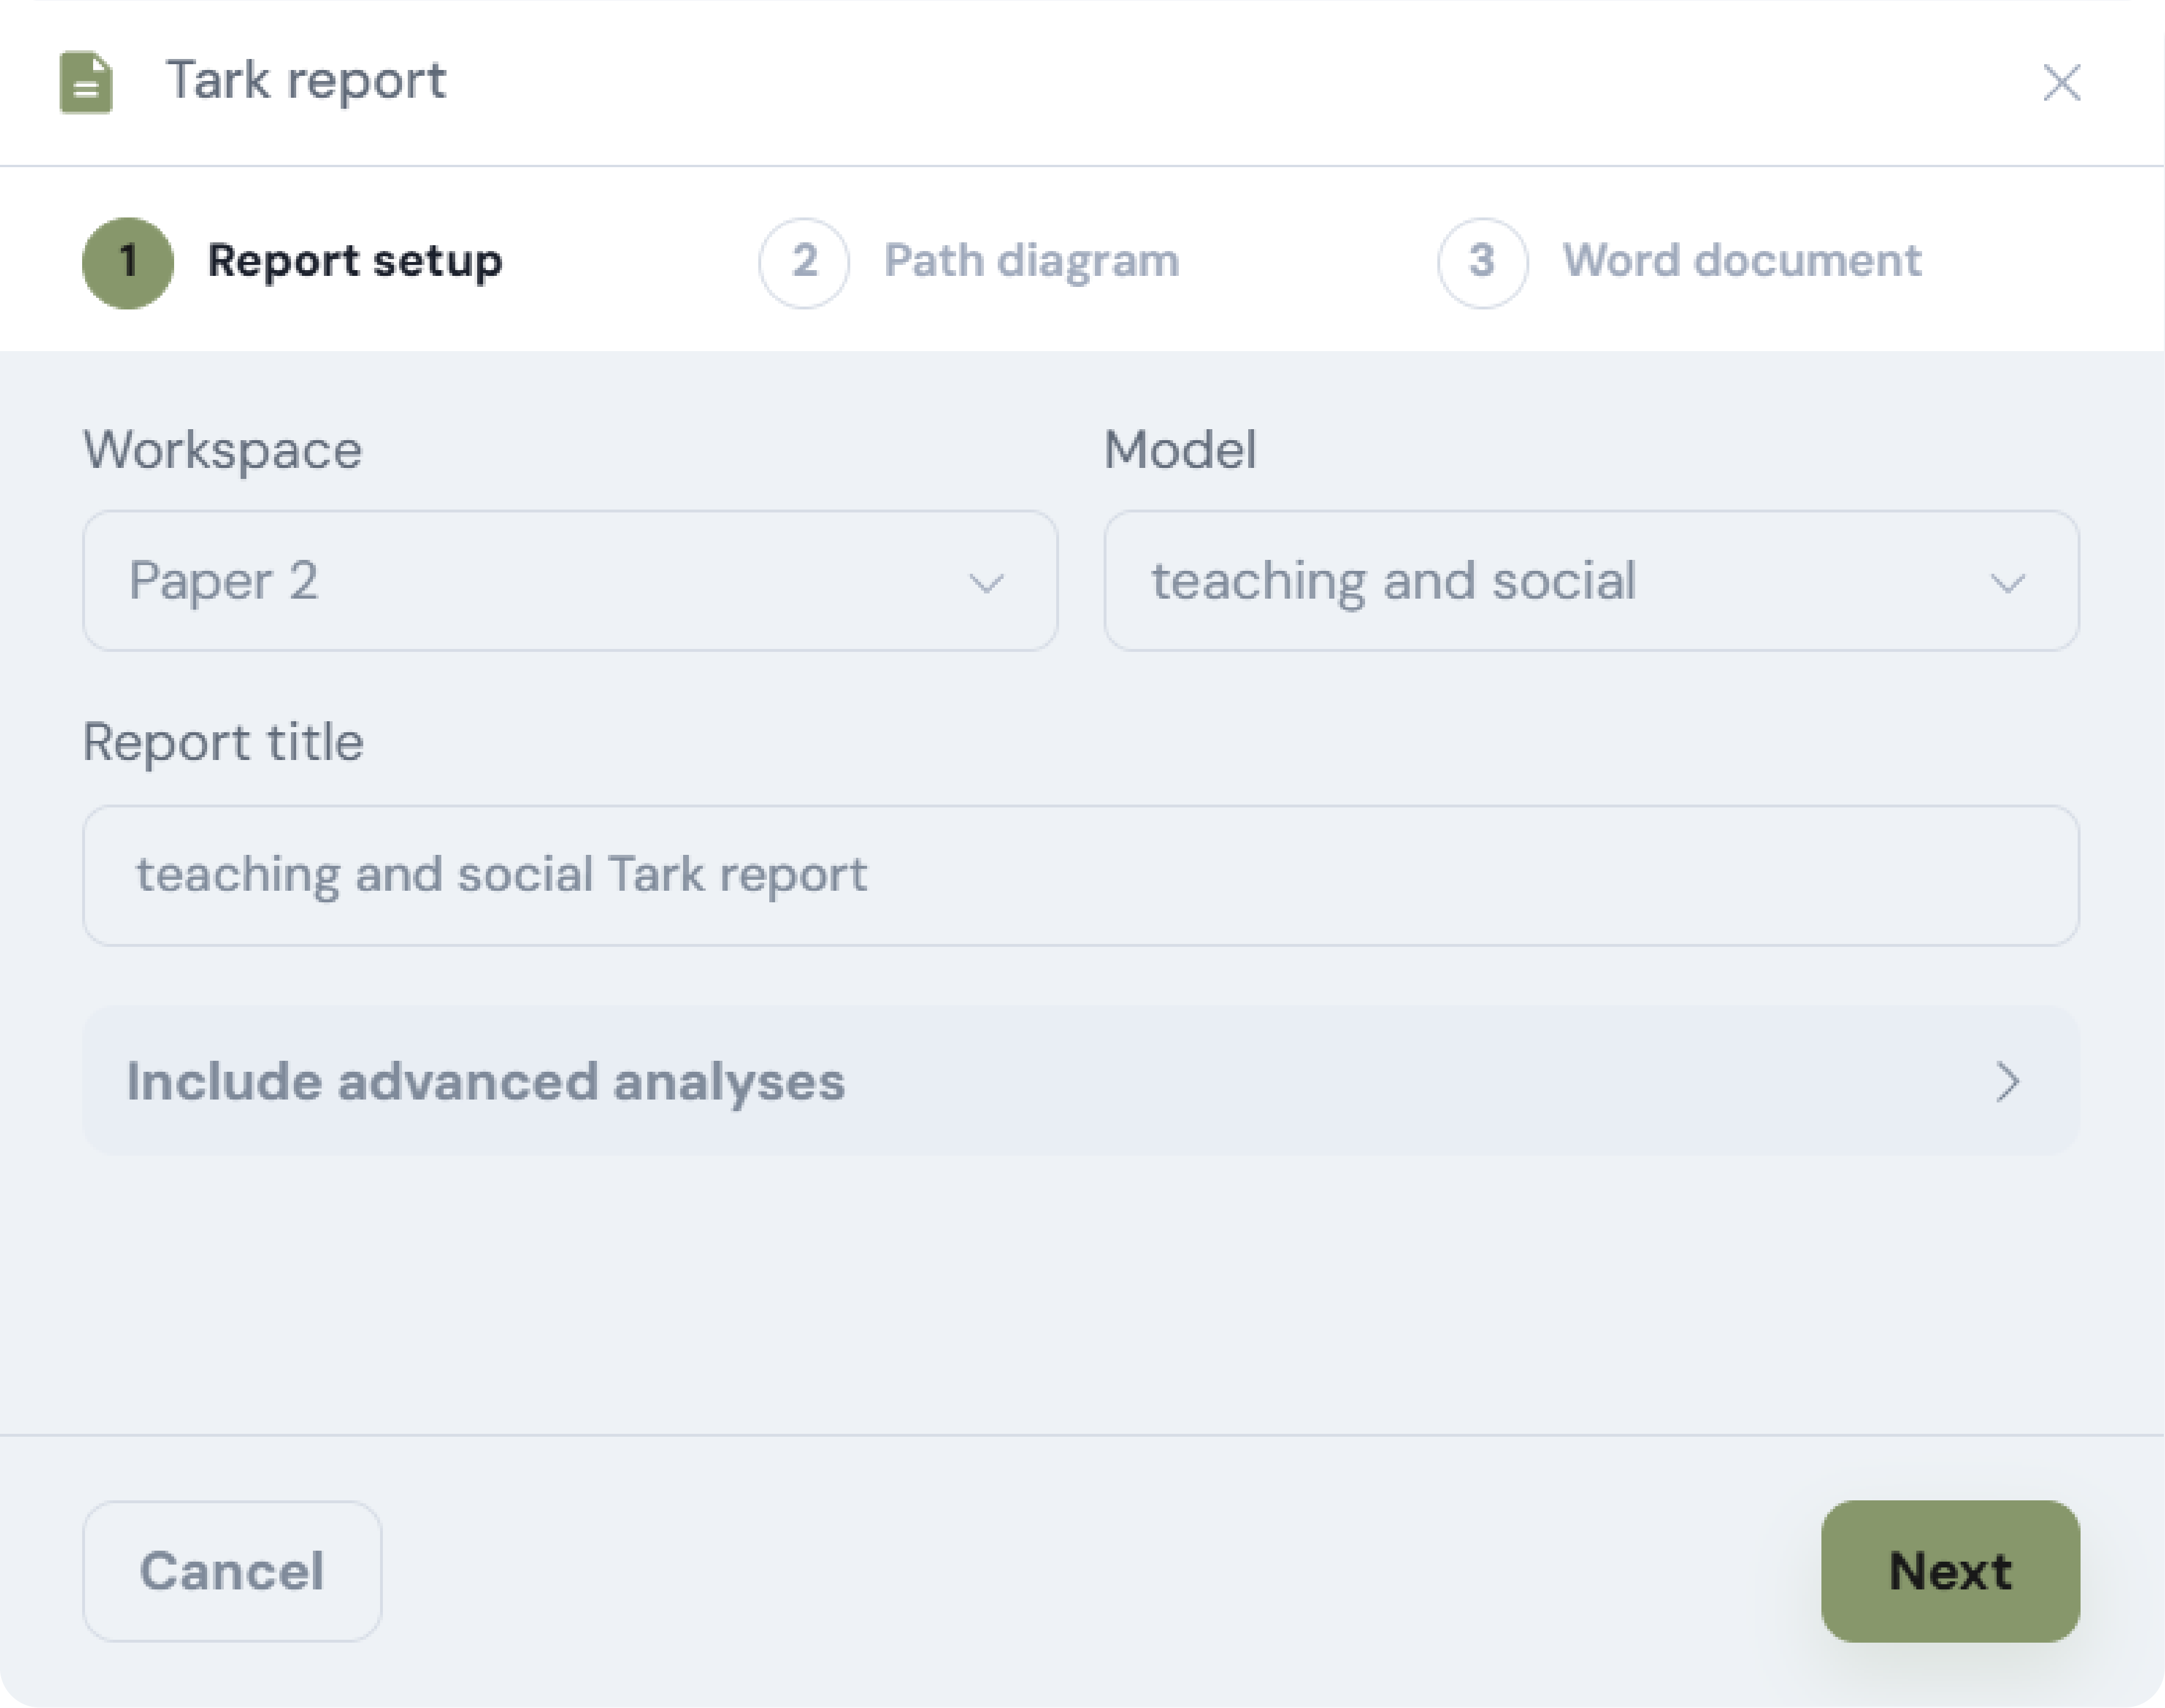
Toggle structural path coefficients, outer loadings, and R² construct indicators.
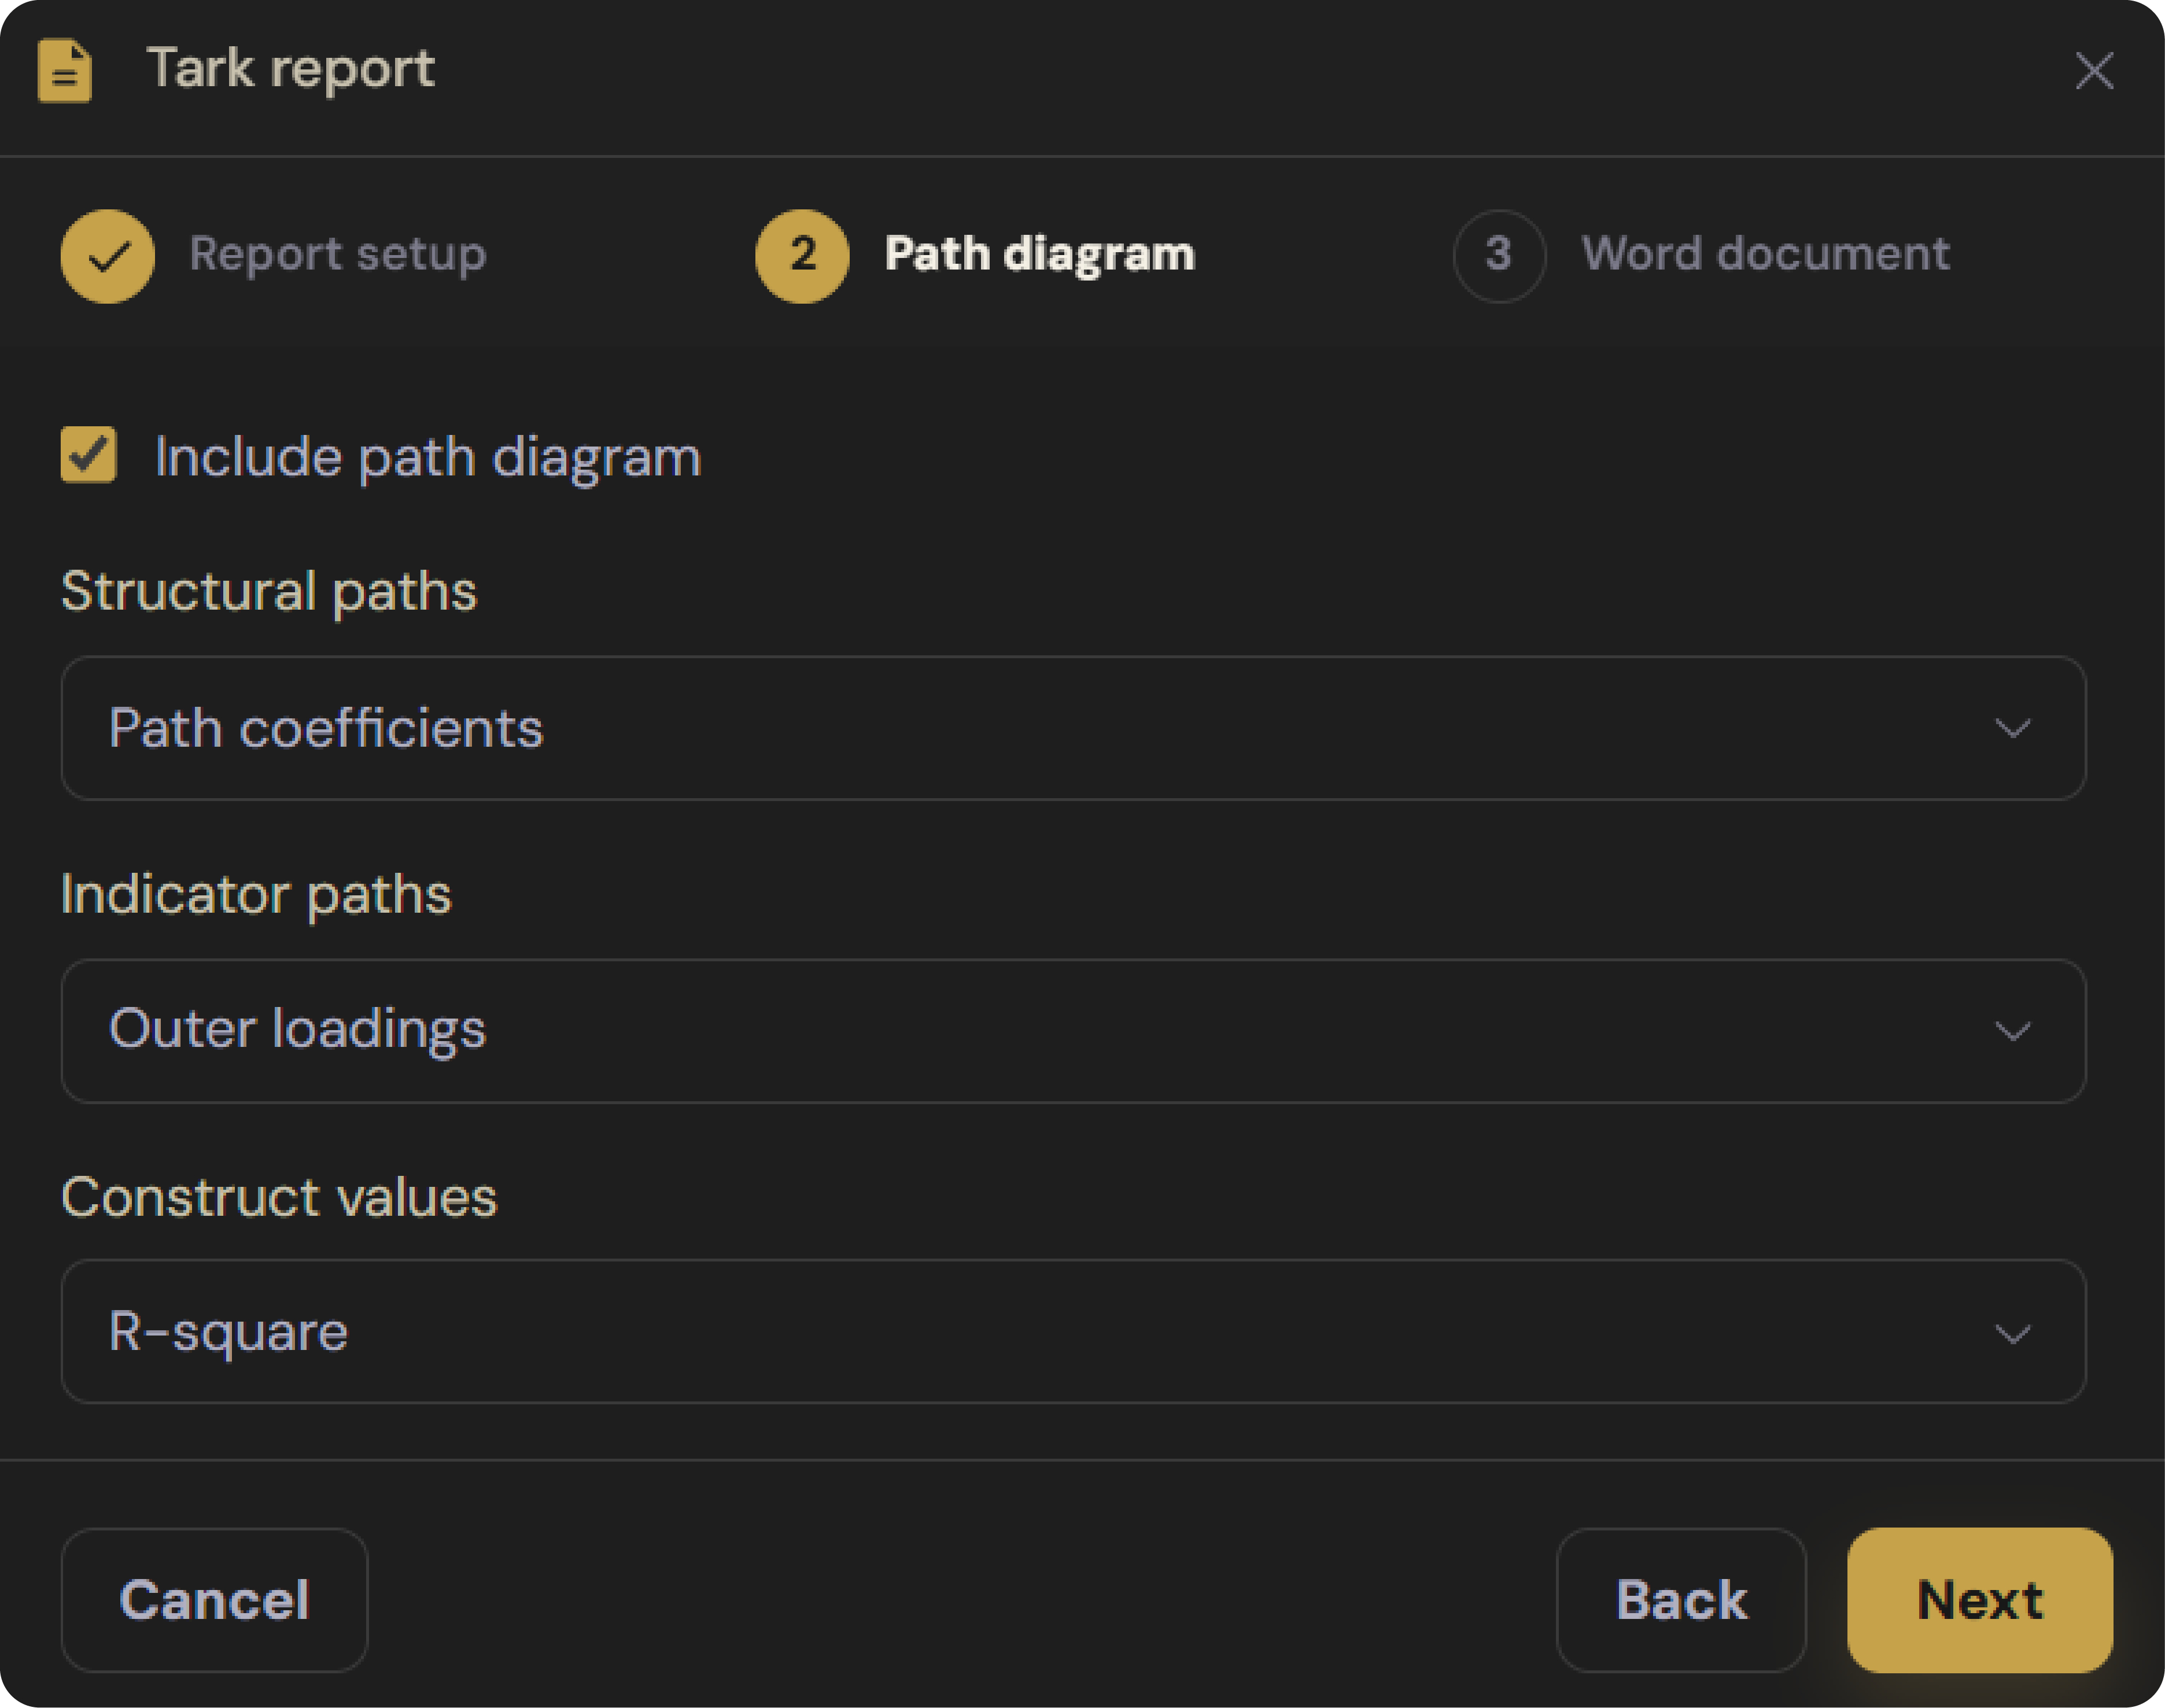
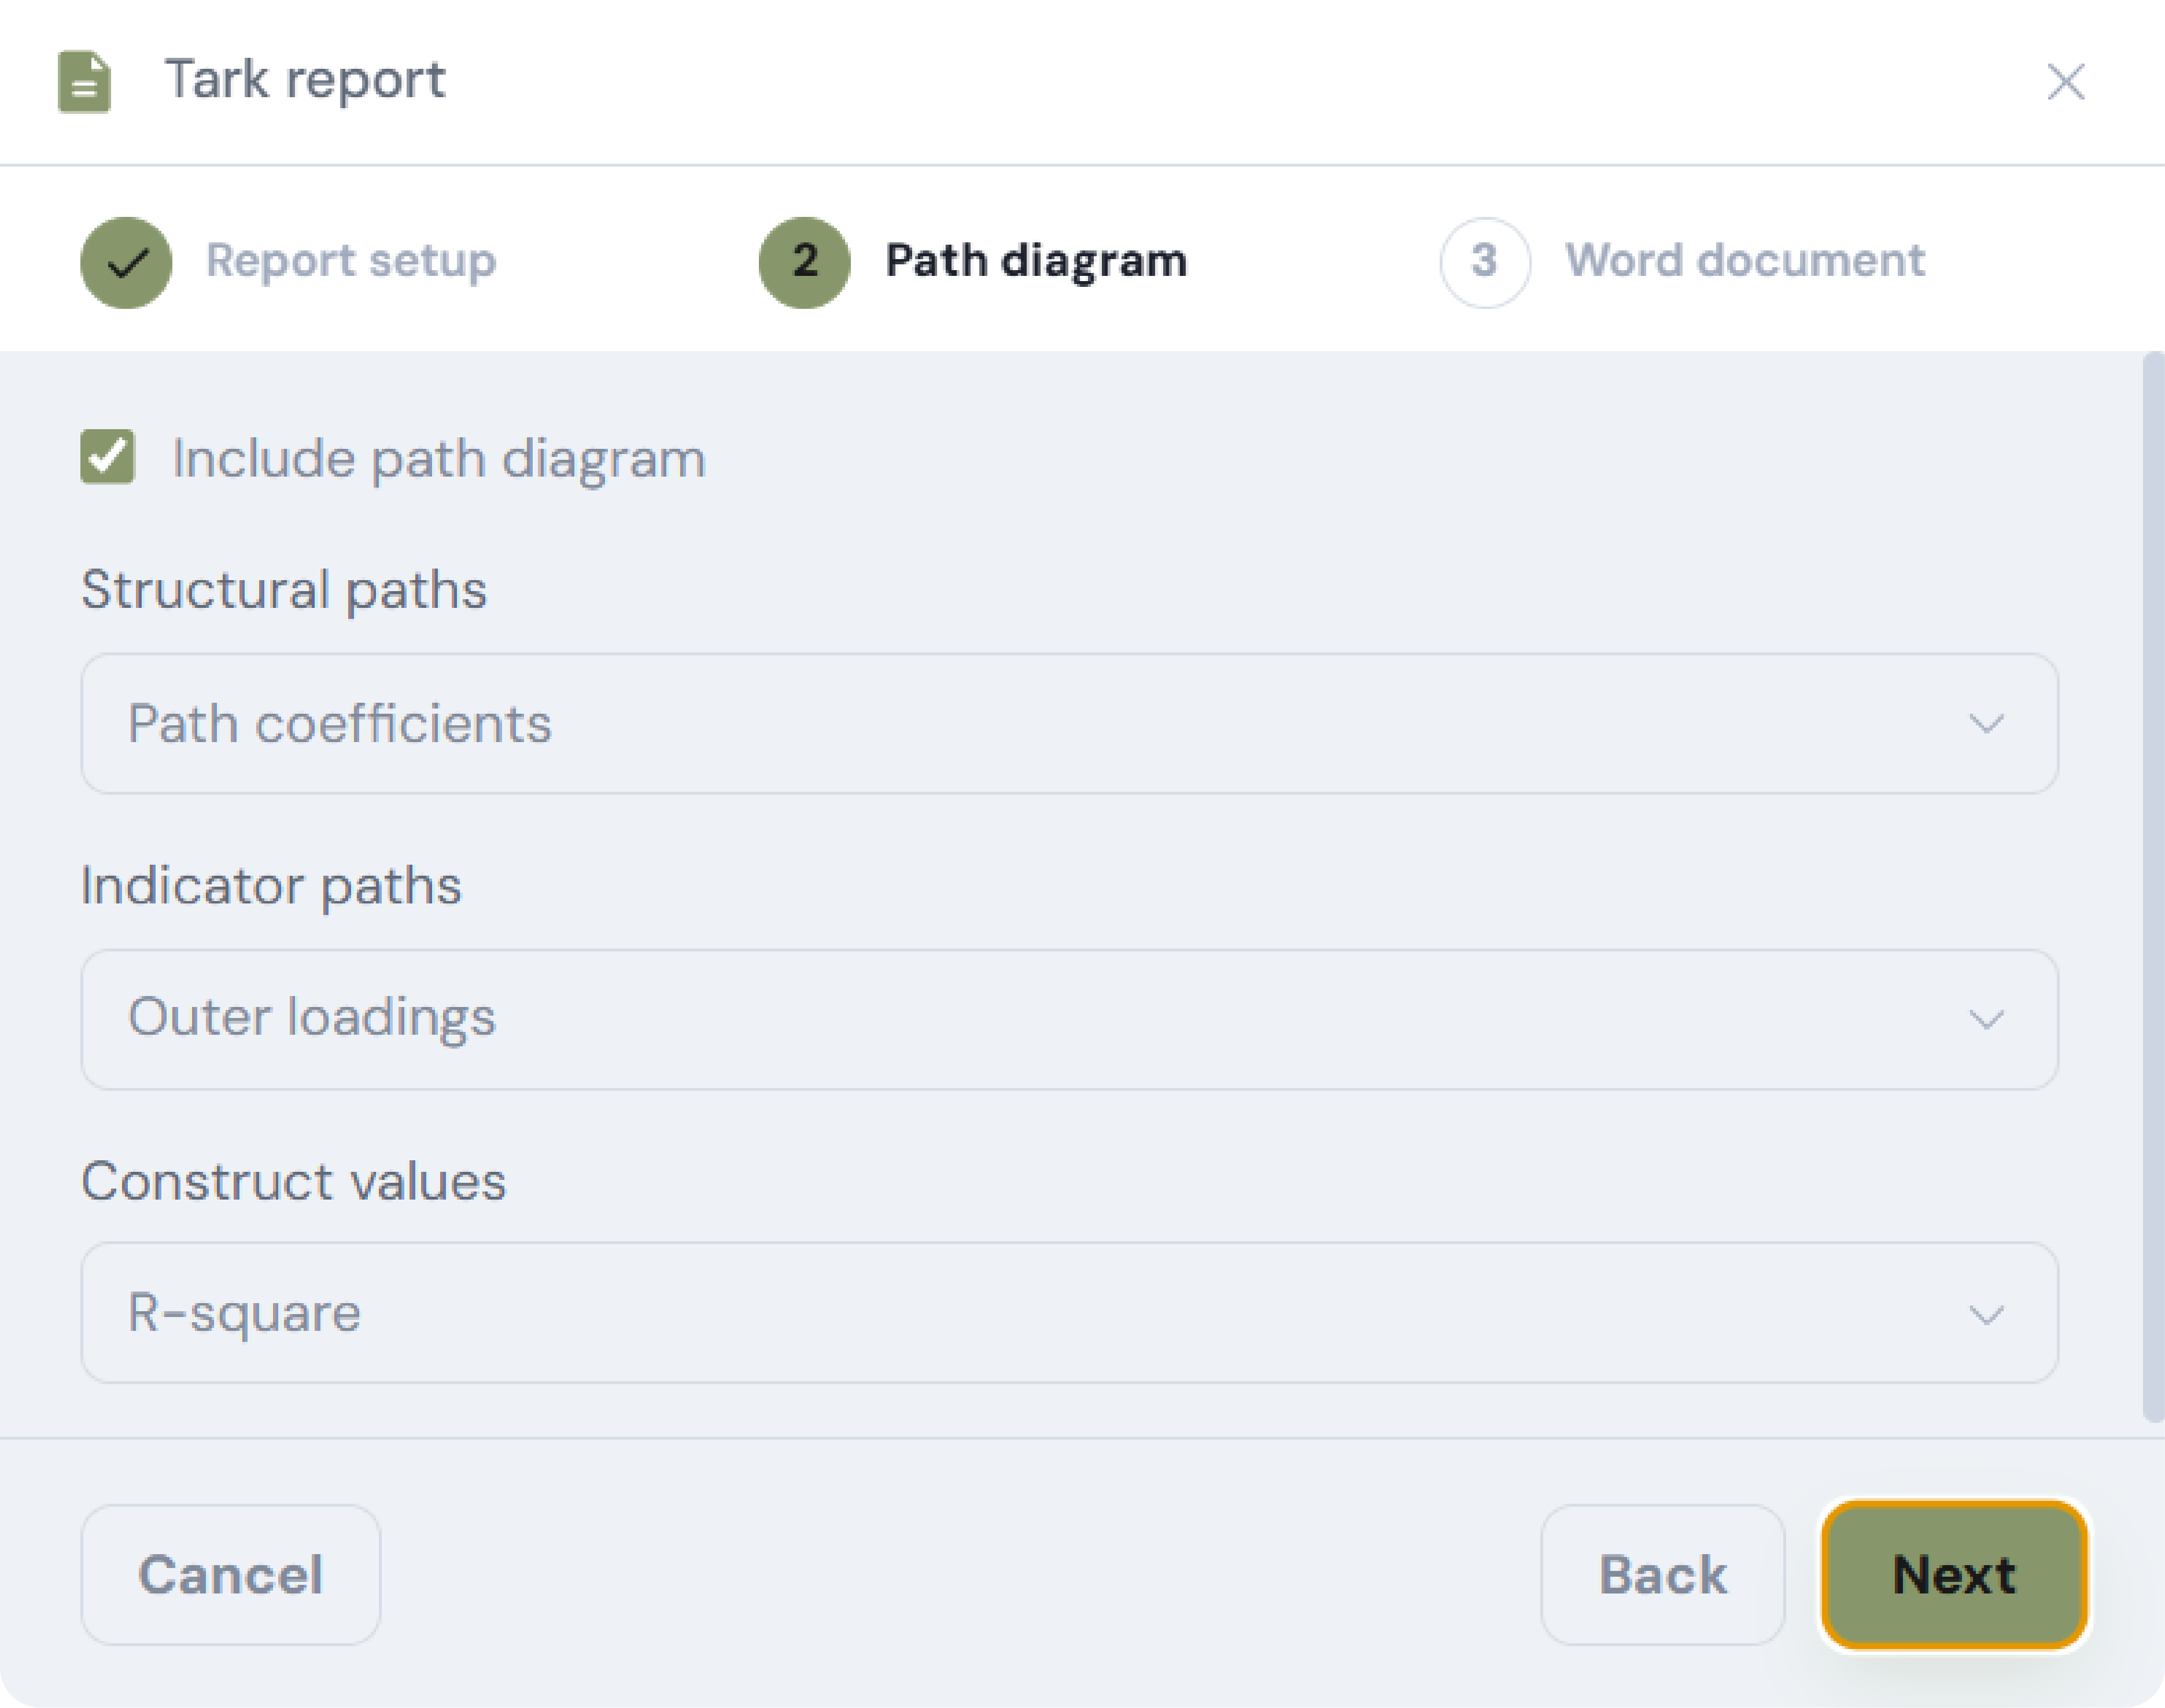
Define output file name, destination directory, and review report summaries.
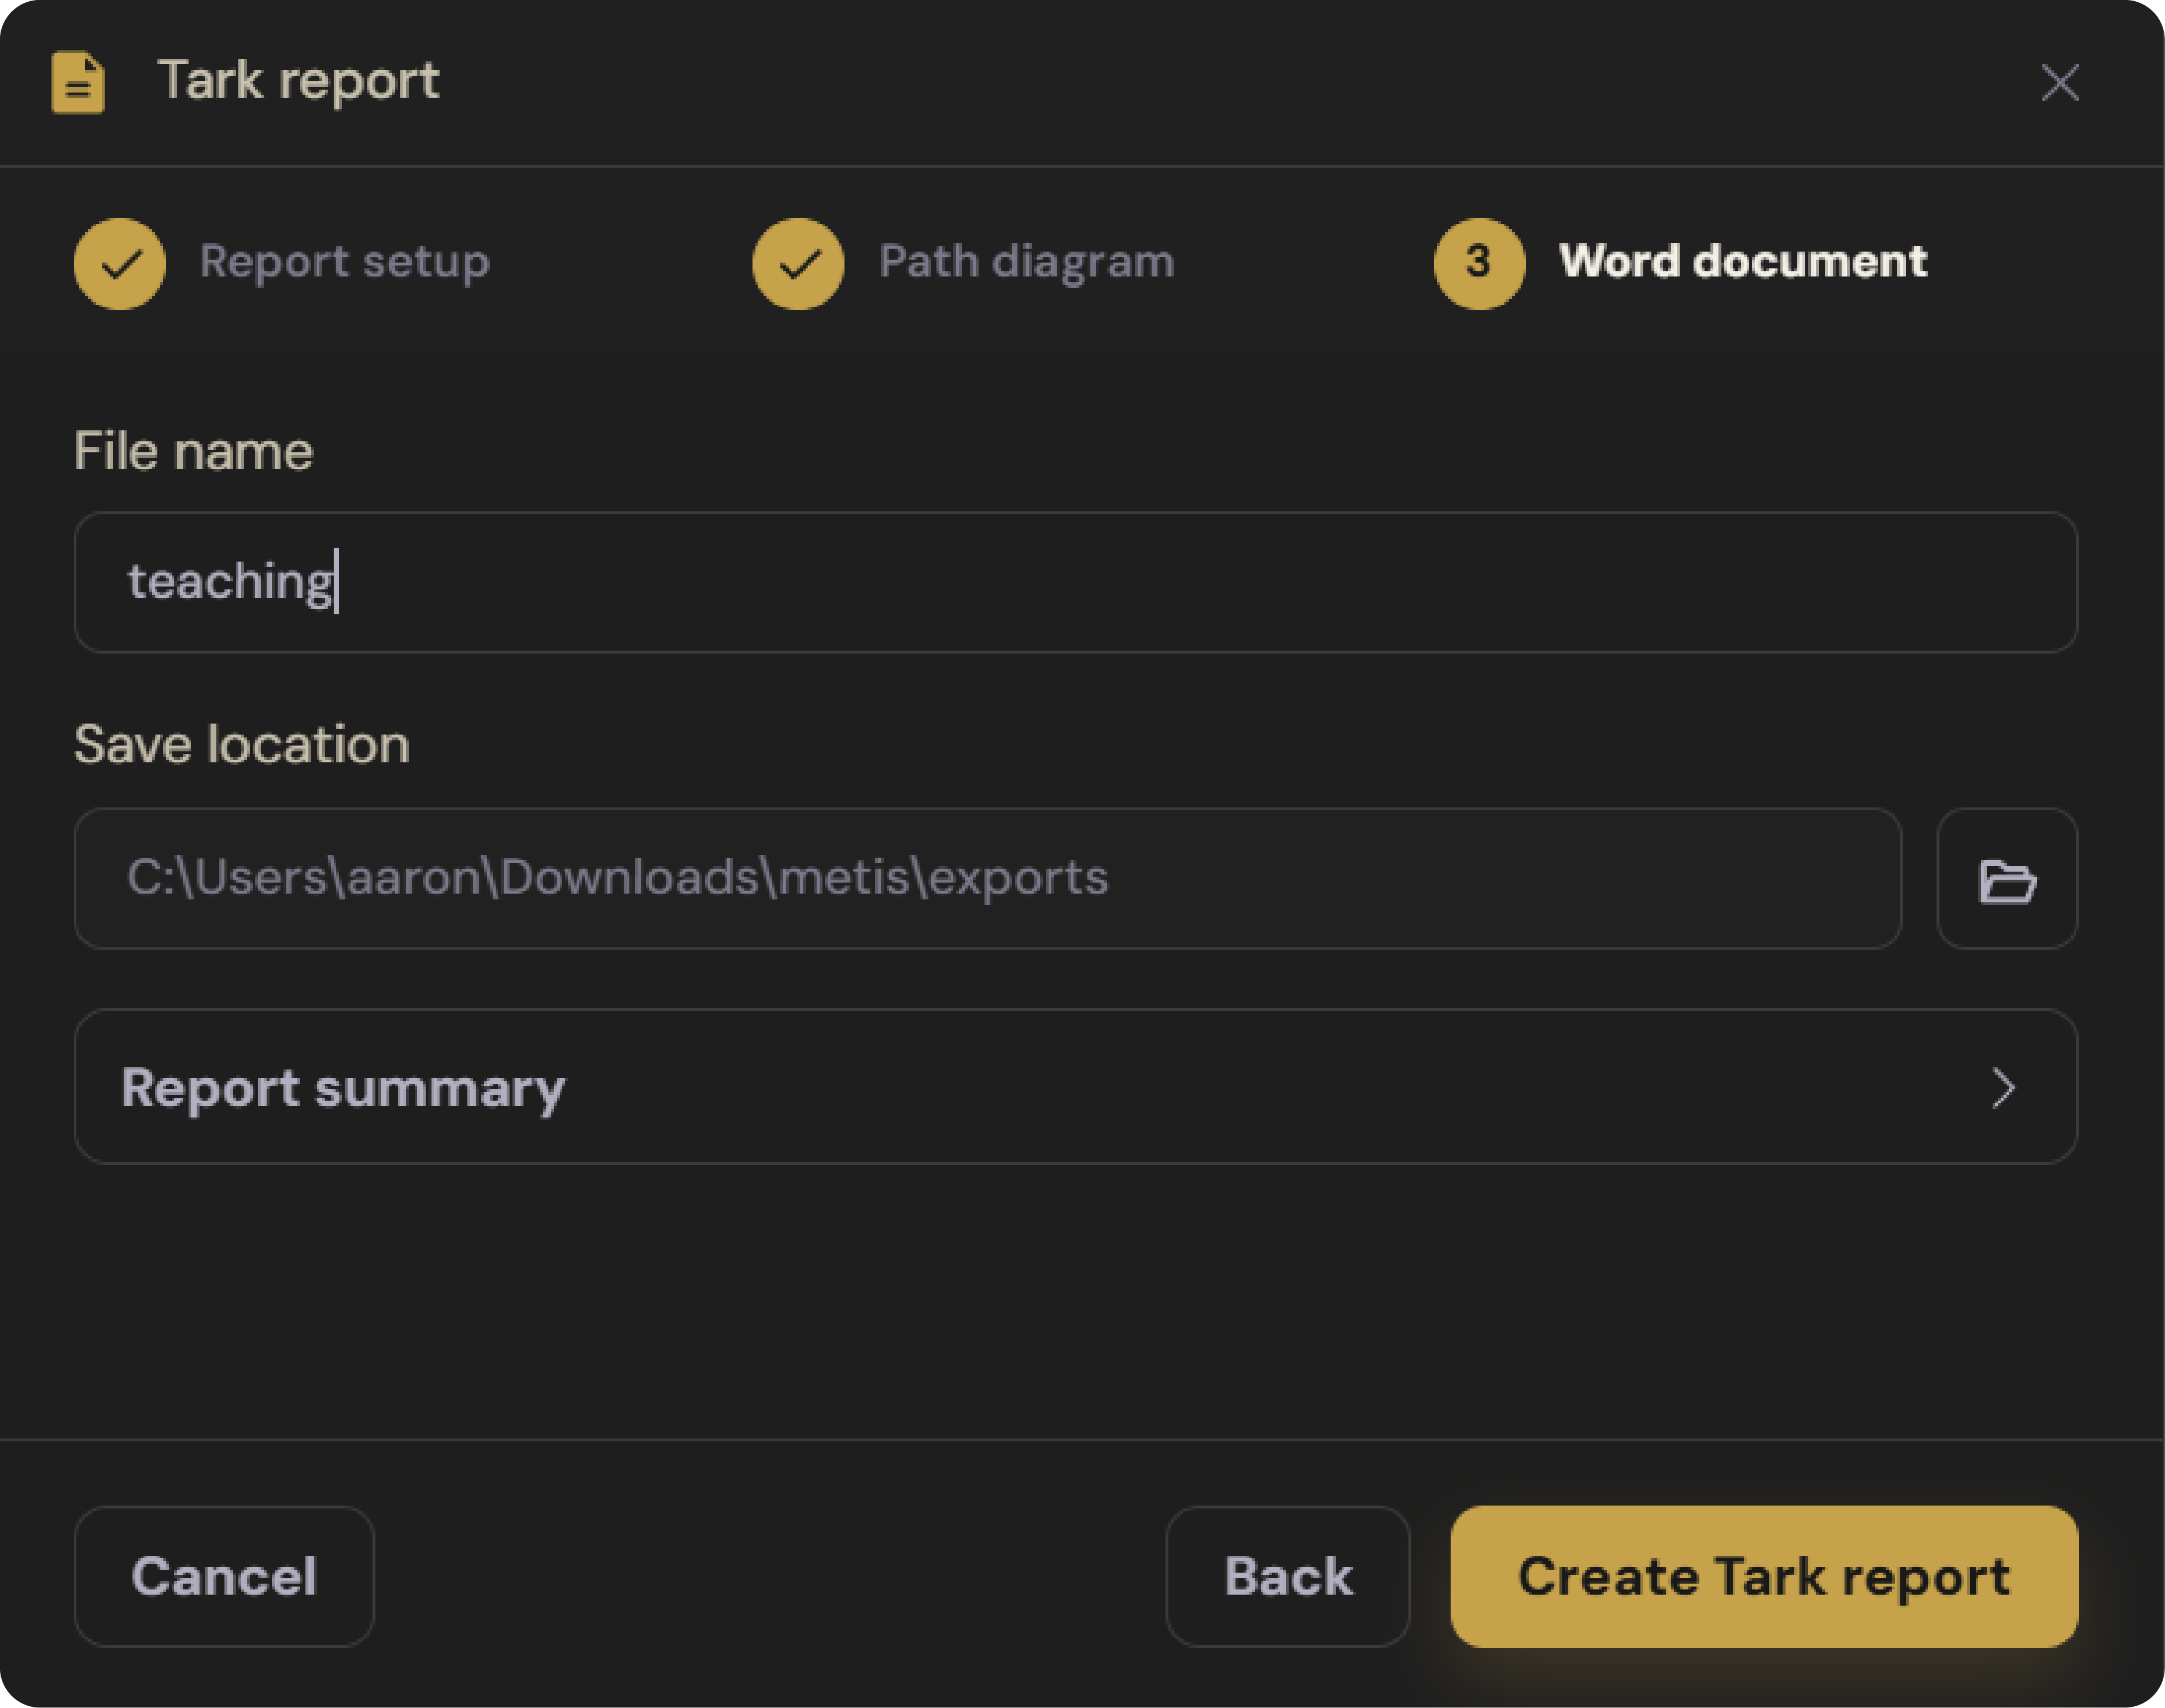
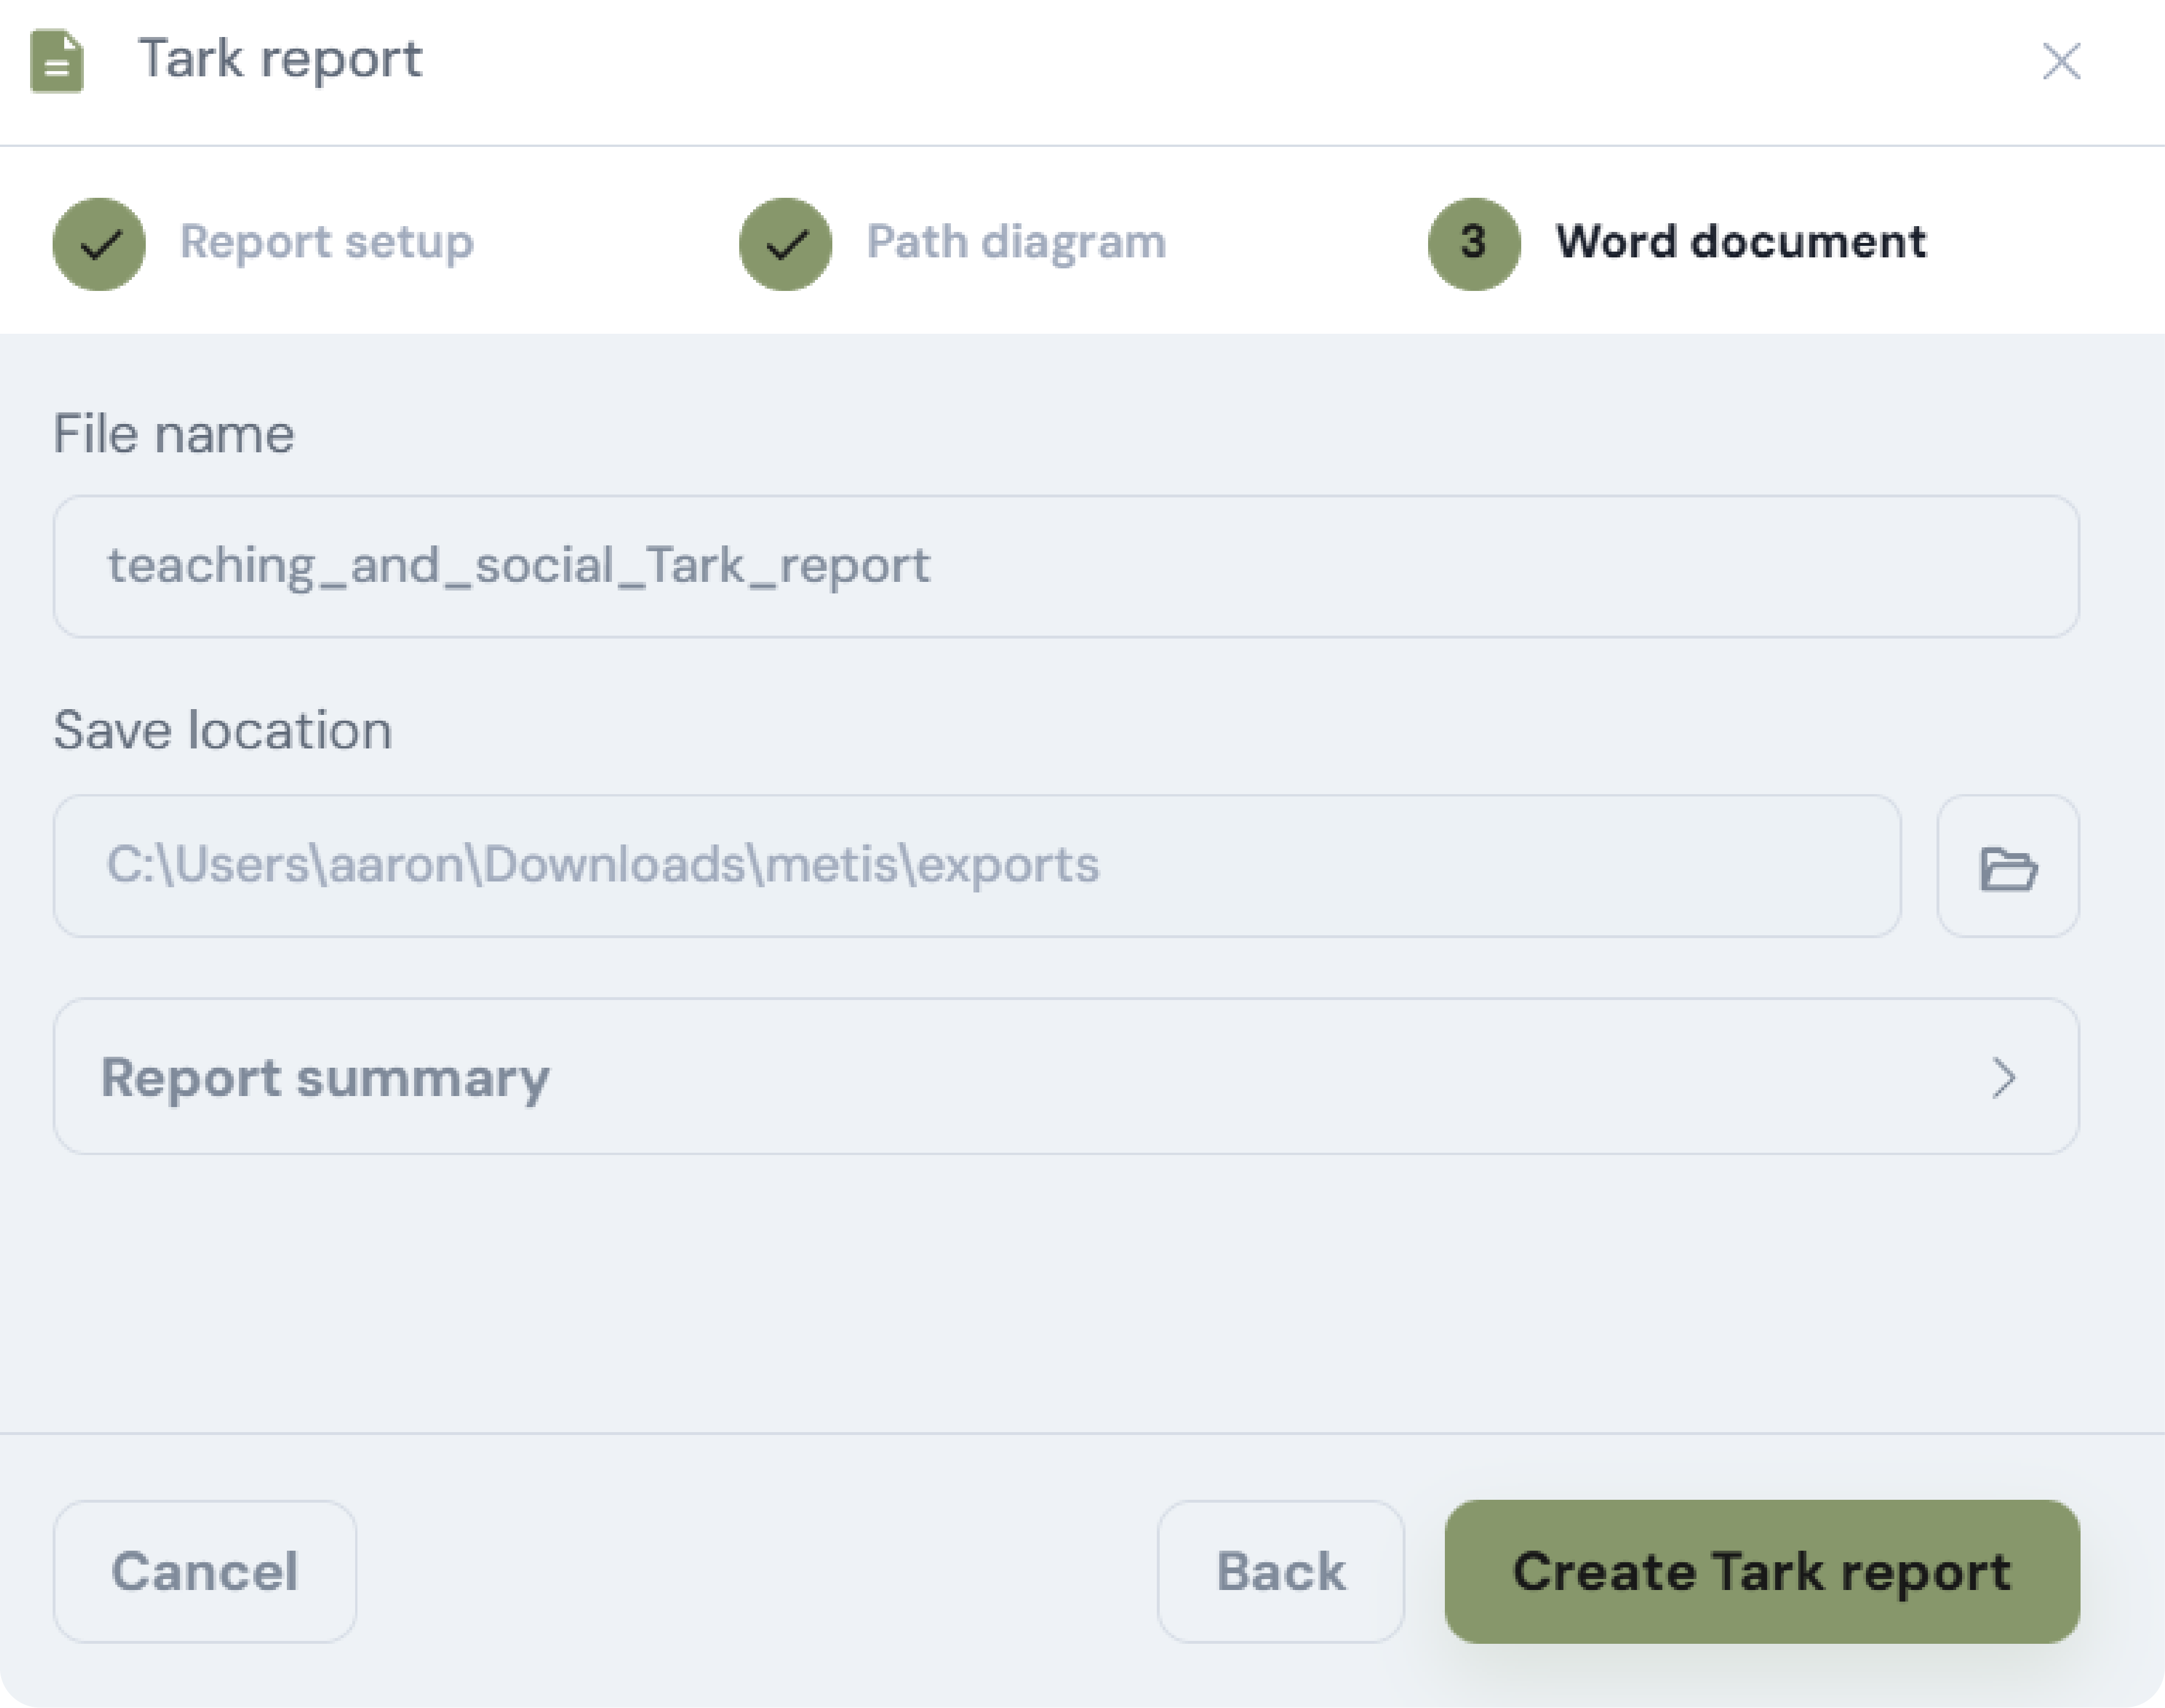
3 simple steps to generate publication-standard Word tables with formatted APA notes.
| Construct | Indicator Loadings | CR | AVE |
|---|---|---|---|
| PEOU | 0.81 / 0.84 / 0.79 | 0.91 | 0.68 |
| PU | 0.83 / 0.85 / 0.80 | 0.90 | 0.67 |
| BI | 0.88 / 0.86 | 0.92 | 0.74 |
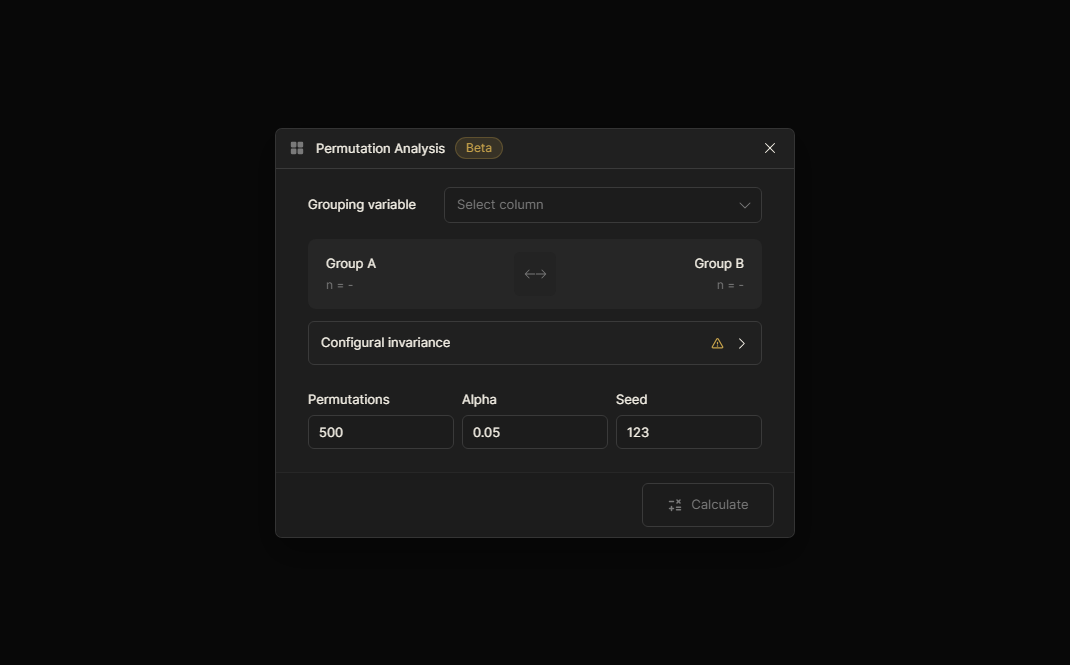
Verify measurement invariance across groups with the 3-step MICOM procedure before conducting multigroup analysis.
Qualitative check confirming identical indicator assignments, composite weighting modes (Mode A/B), data treatment, and estimation algorithms across groups.
Permutation testing of composite weight correlation c (1,000 to 5,000 draws). Includes deterministic sign alignment algorithm to prevent false non-invariance.
Evaluates composite score mean equality and log-variance equality across pooled sub-populations to establish full measurement invariance.
Compare structural relationships across distinct sub-populations, user demographics, or experimental conditions.
Non-parametric permutation and bootstrap tests to determine if path coefficients differ significantly between group subsets (p < 0.05 or p > 0.95).
Evaluate path differences assuming equal or unequal variances across sample sizes, providing robust statistical verification.
Automatically generate APA 7 formatted MGA path comparison tables, confidence intervals, and effect sizes ready for publication.
Metis is a desktop application for Partial Least Squares Structural Equation Modelling (PLS-SEM). It brings dataset management, visual model building, statistical analysis, results exploration, and reporting into one workspace. Statistical calculations run through R, primarily using seminr, while Metis provides the visual workflow around the analysis.
Both installers provide the same Metis application. Bundle is recommended for most users—it includes the complete R calculation environment and does not require installing R separately. Lite is intended for users who already have R installed.
No. Metis uses R in the background, but normal model building, analysis and reporting are performed through the graphical interface. Users who want to inspect or reproduce their analysis in R can also export or copy the corresponding R script.
No. Model data, calculations, workspaces, saved results and Tark reports are processed and stored locally on your computer. Metis does not require your research dataset to be uploaded to a cloud analysis service.
Yes. Metis is distributed free of charge and released under the GNU General Public Licence v3 (GPL-3). There is no subscription required to run analyses.
The workflow includes PLS-SEM, Bootstrapping, PLSpredict, CVPAT, Importance-Performance Map Analysis (IPMA), Necessary Condition Analysis (NCA), combined cIPMA, 3-stage MICOM measurement invariance, Multigroup Analysis (MGA), higher-order constructs, moderation analysis, and automated Tark reporting.
Tark is the reporting assistant built into Metis. It collects selected saved results and converts them into structured tables and optional model diagrams for use in a thesis, dissertation, paper or report, significantly reducing repetitive formatting work.
Yes. Metis is designed for academic research workflows. For the current release, cite Metis in-text as (Metis, 2026) and seminr as (Ringle et al., 2024).
A research-grade desktop workflow for building and interpreting PLS-SEM models.
Start with the version that fits your setup and keep model design, calculation, and interpretation in one connected environment.
If metis supports your thesis, paper, teaching, or research project, please cite the software.
(Metis, 2026)
Metis. (2026). Metis: Free PLS-SEM desktop software for academic researchers (Version 0.3.1) [Computer software]. https://metis.emend.it.com
Explore user guides, workflow tutorials, and analysis documentation.
read the docsv0.3.1
Preferences and algorithm defaults hub, interactive missing-value finder, modernized single-file workspaces, higher-order construct modeling, and enhanced predictive summaries.
release notesBuilt with early feedback from researchers at KNUST and now opening to the broader international academic community.
Welcome — review each update, then build your first model.
Pin a note to the wall
Optional — your note goes straight to the wall. Anonymous works too.