Tark Report Builder
Automated, journal-ready Word (.docx) document generator and APA 7 table builder for PLS-SEM models in metis app.
1. What is Tark?
Tark is the automated reporting helper built directly into metis desktop app. Preparing statistical results for a dissertation, master's thesis, or peer-reviewed journal article often requires hours of tedious manual reformatting, copying table values, formatting confidence intervals, and aligning vector diagrams.
Tark automates this entire pipeline. Once you have estimated your model and saved your analysis runs, Tark inspects your workspace, compiles all measurement and structural metrics, formats them into APA 7 compliant tables, generates high-resolution path diagrams, and exports a clean Word document (.docx) ready for submission.
Want to see how Tark generates and formats reports? Download a real sample Word document generated directly by Tark to inspect its APA 7 tables, outer loading matrices, HTMT discriminant validity, structural hypothesis tests, predictive comparisons, and embedded vector diagrams.
Tark eliminates manual copy-paste errors. All numbers, p-values, bias-corrected confidence intervals, and construct metrics are pulled directly from the underlying seminr statistical objects.
2. Model Prerequisites & Requirements
To ensure report completeness, Tark enforces a verification check on saved analysis runs before building a report.
Required Base Analyses
- PLS-SEM Model Estimation: Active model with estimated outer loadings, path coefficients, R2, and f2 effect sizes.
- Bootstrap Run: Non-parametric bootstrap (minimum 5,000 samples recommended) generating t-statistics, p-values, and 95% bias-corrected percentile confidence intervals.
- PLSpredict Run: 10-fold cross-validated out-of-sample predictive metrics (Q2predict, RMSE, MAE, and Linear Model benchmark differences).
Optional Advanced Analyses
Tark seamlessly incorporates optional analysis modules when present in your workspace:
- Necessary Condition Analysis (NCA): Bottleneck tables and ceiling envelope accuracy statistics.
- Importance-Performance Map Analysis (IPMA / cIPMA): Construct importance-performance matrices and target priority recommendations.
- Metis MICOM (Permutation Invariance): Step 1 configural, Step 2 compositional, and Step 3 mean/variance invariance summary tables.
- Multigroup Analysis (MGA): Group path difference comparisons and parametric/non-parametric decision columns.
3. The 3-Step Tark Workflow
Building a complete paper report in Tark requires just three simple steps:
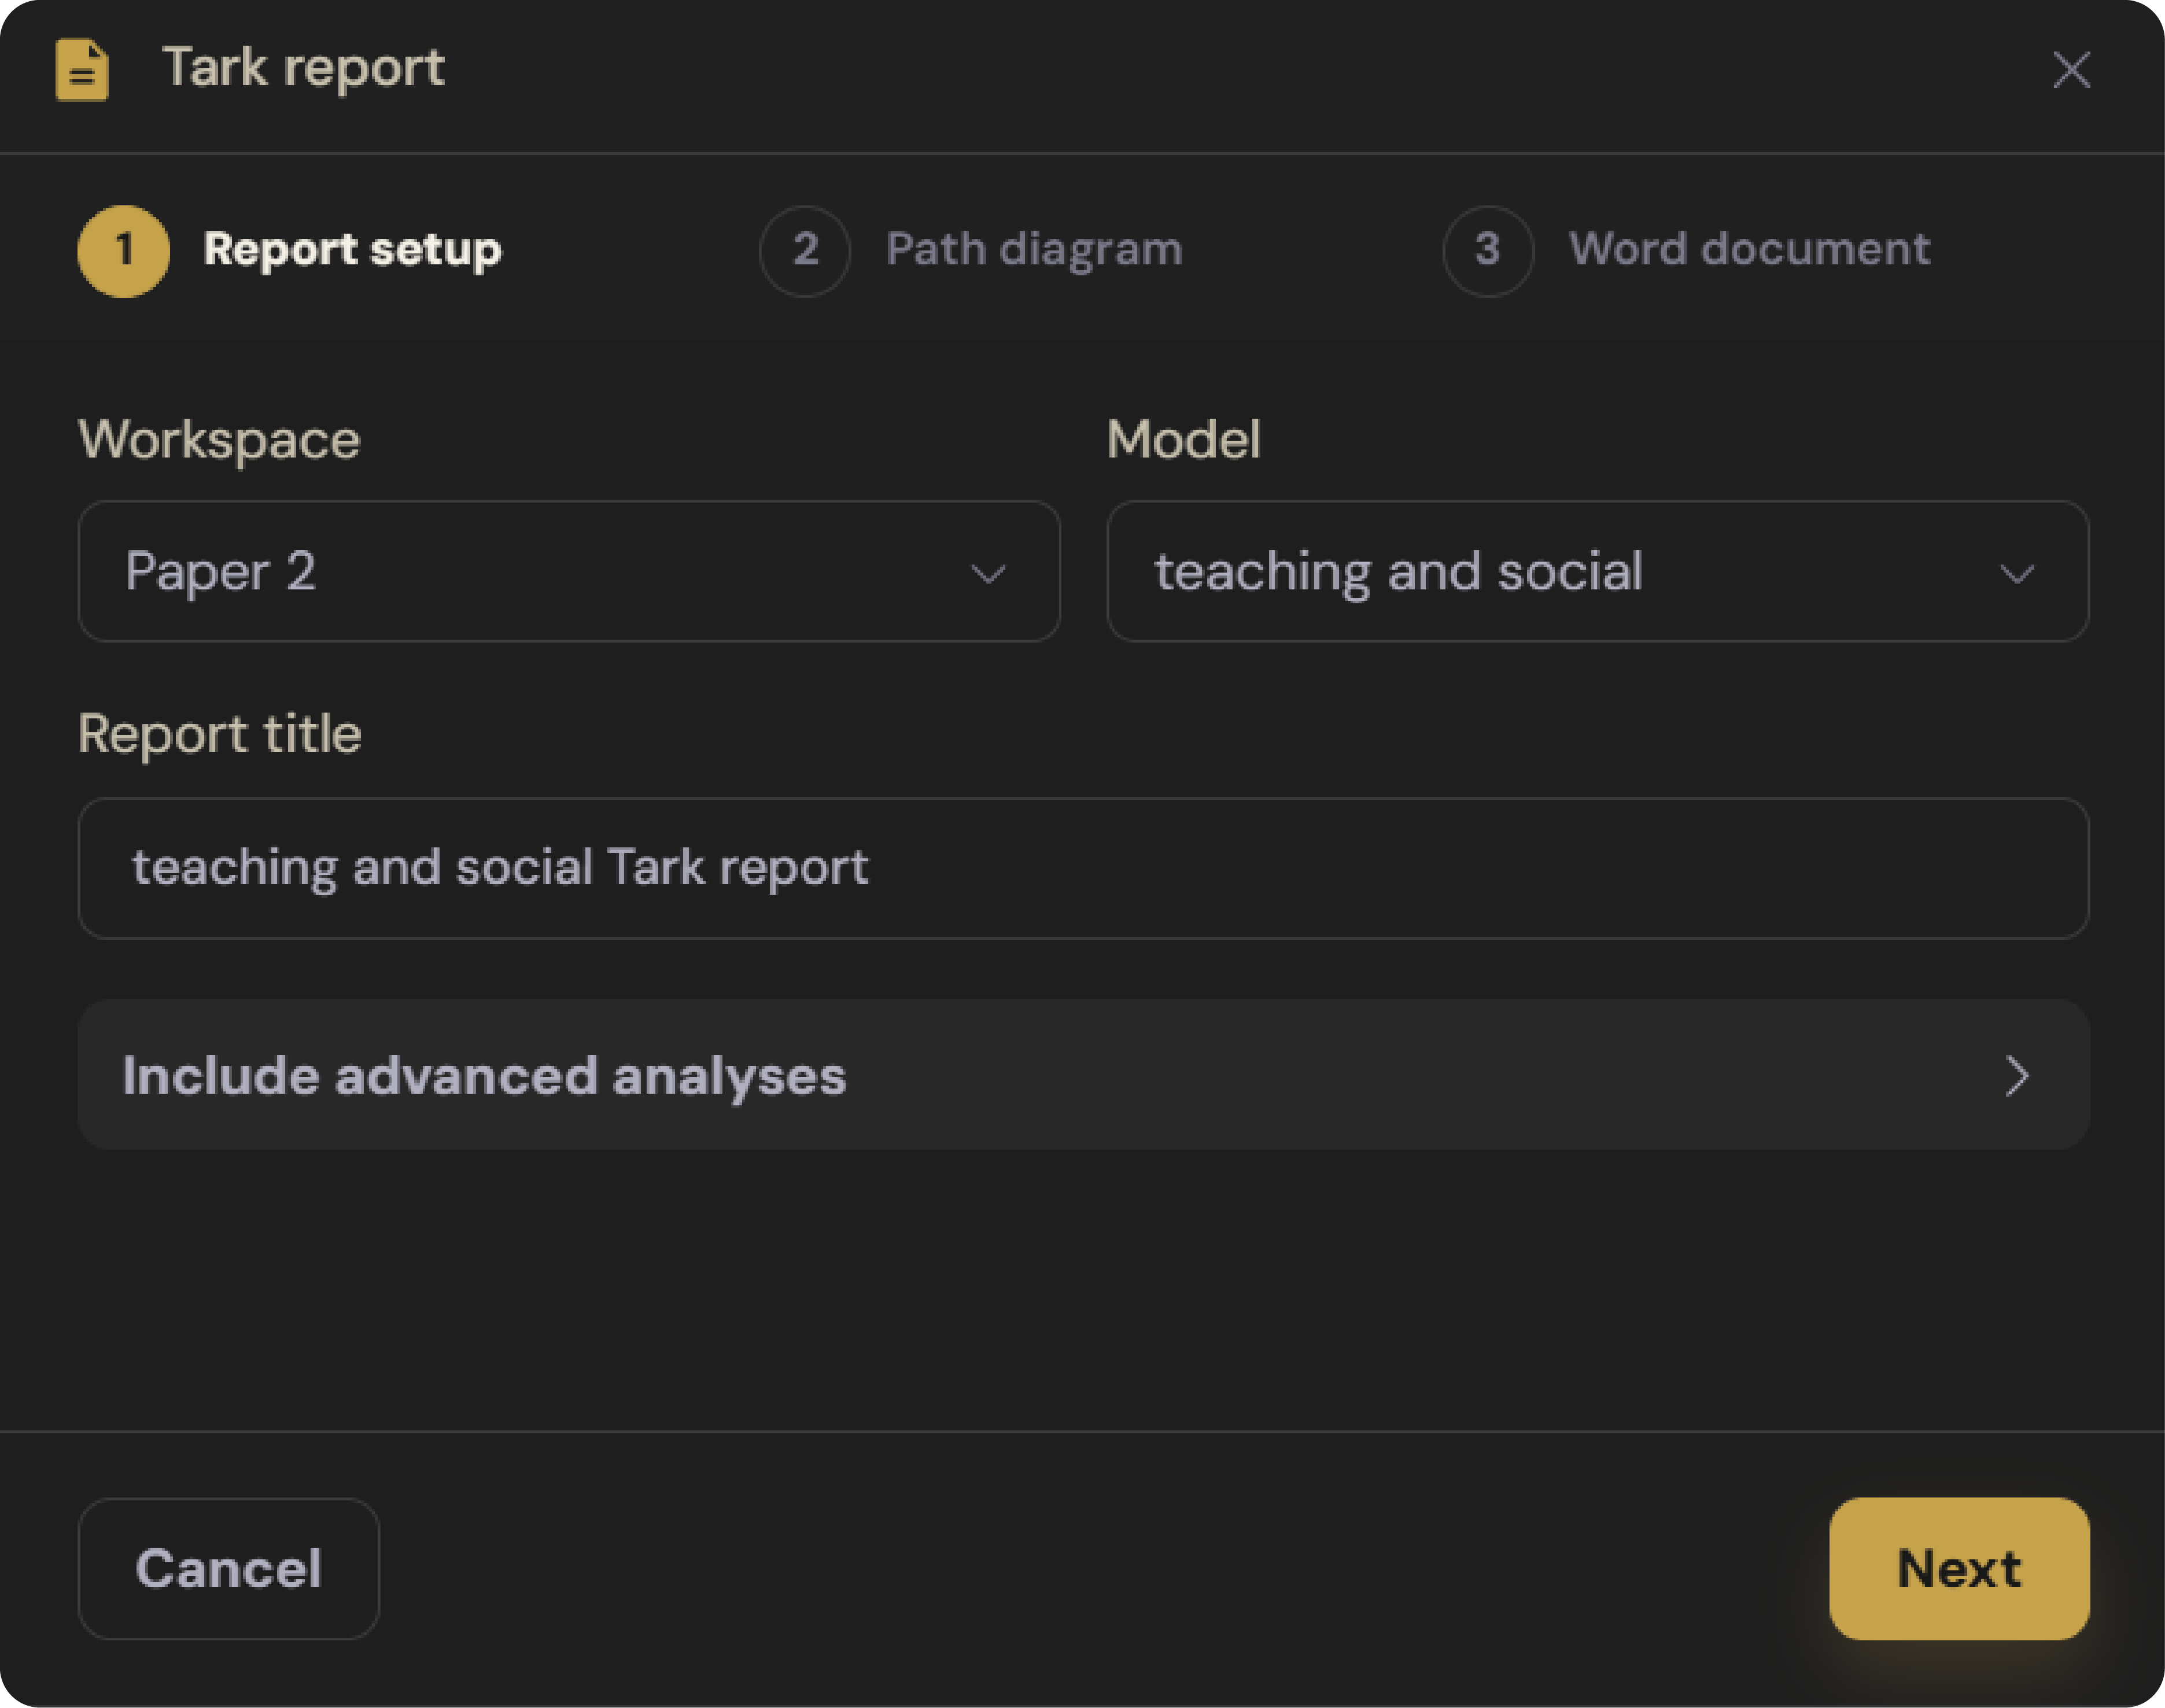
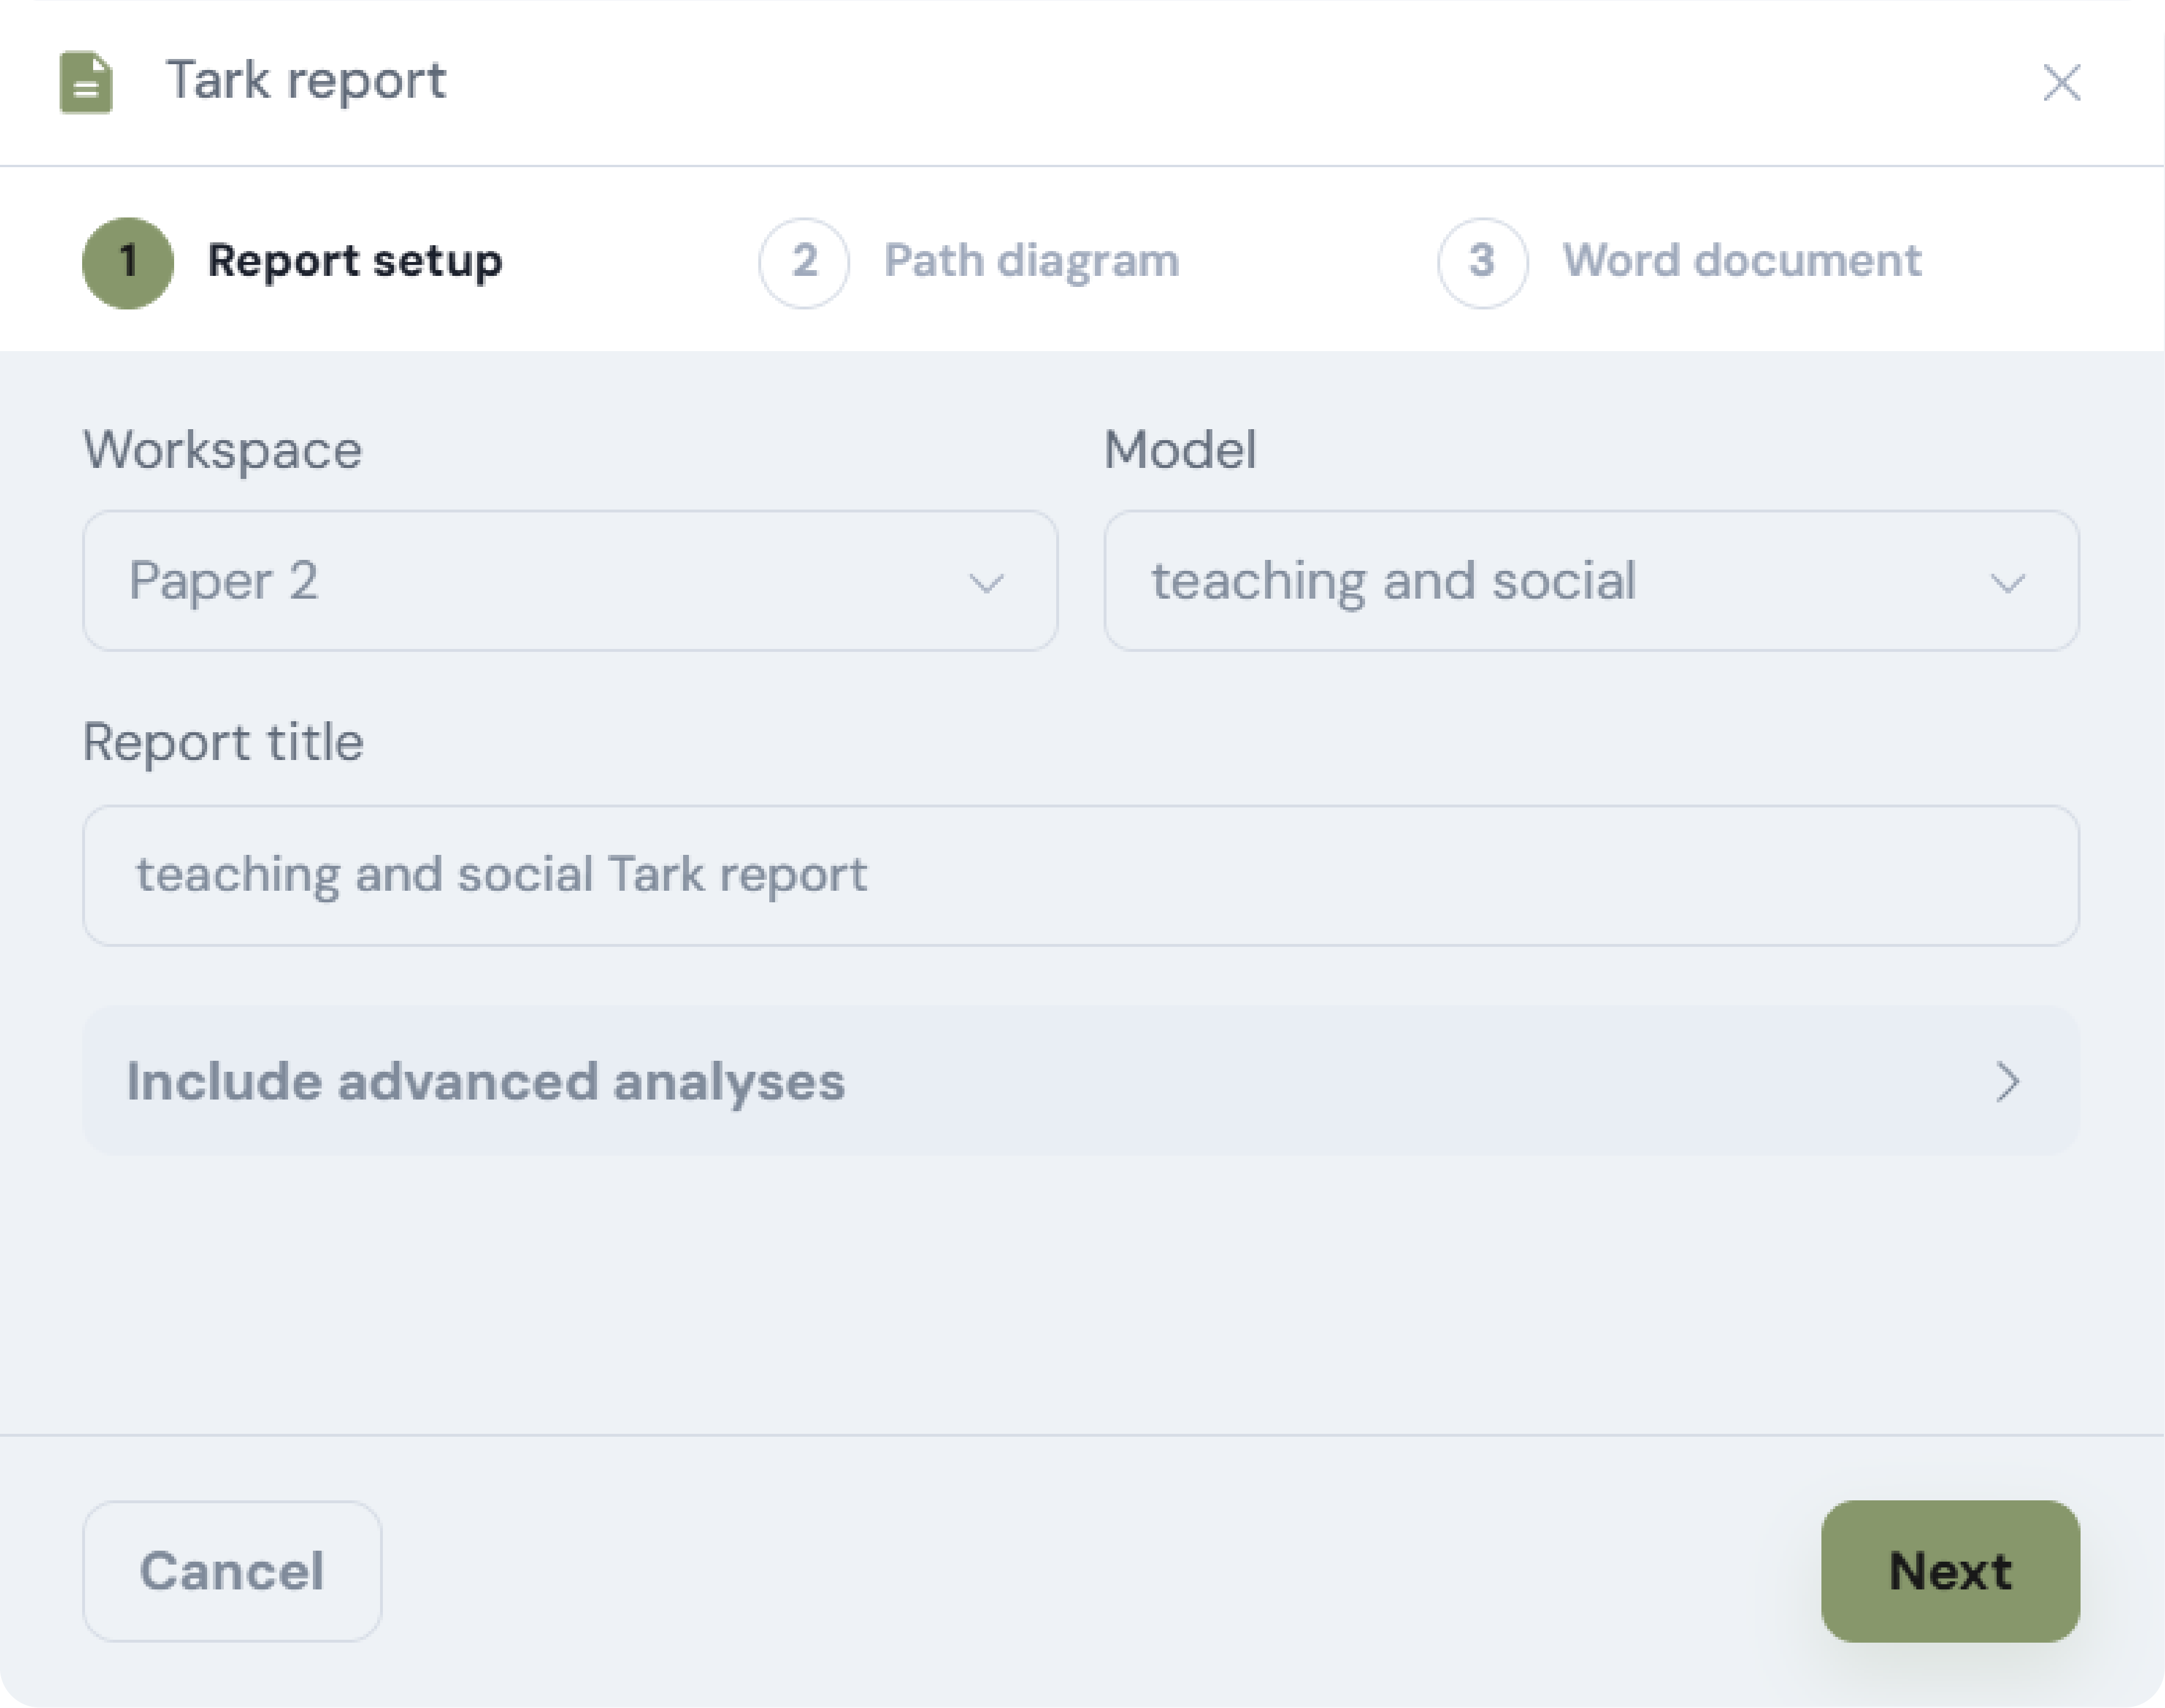
Step 1 — Report Setup
Select your active .metisws workspace and target PLS-SEM model. Enter a custom document title (e.g., "User Acceptance & Information System Continuous Use Model") and check the optional analyses you wish to include in your final export.
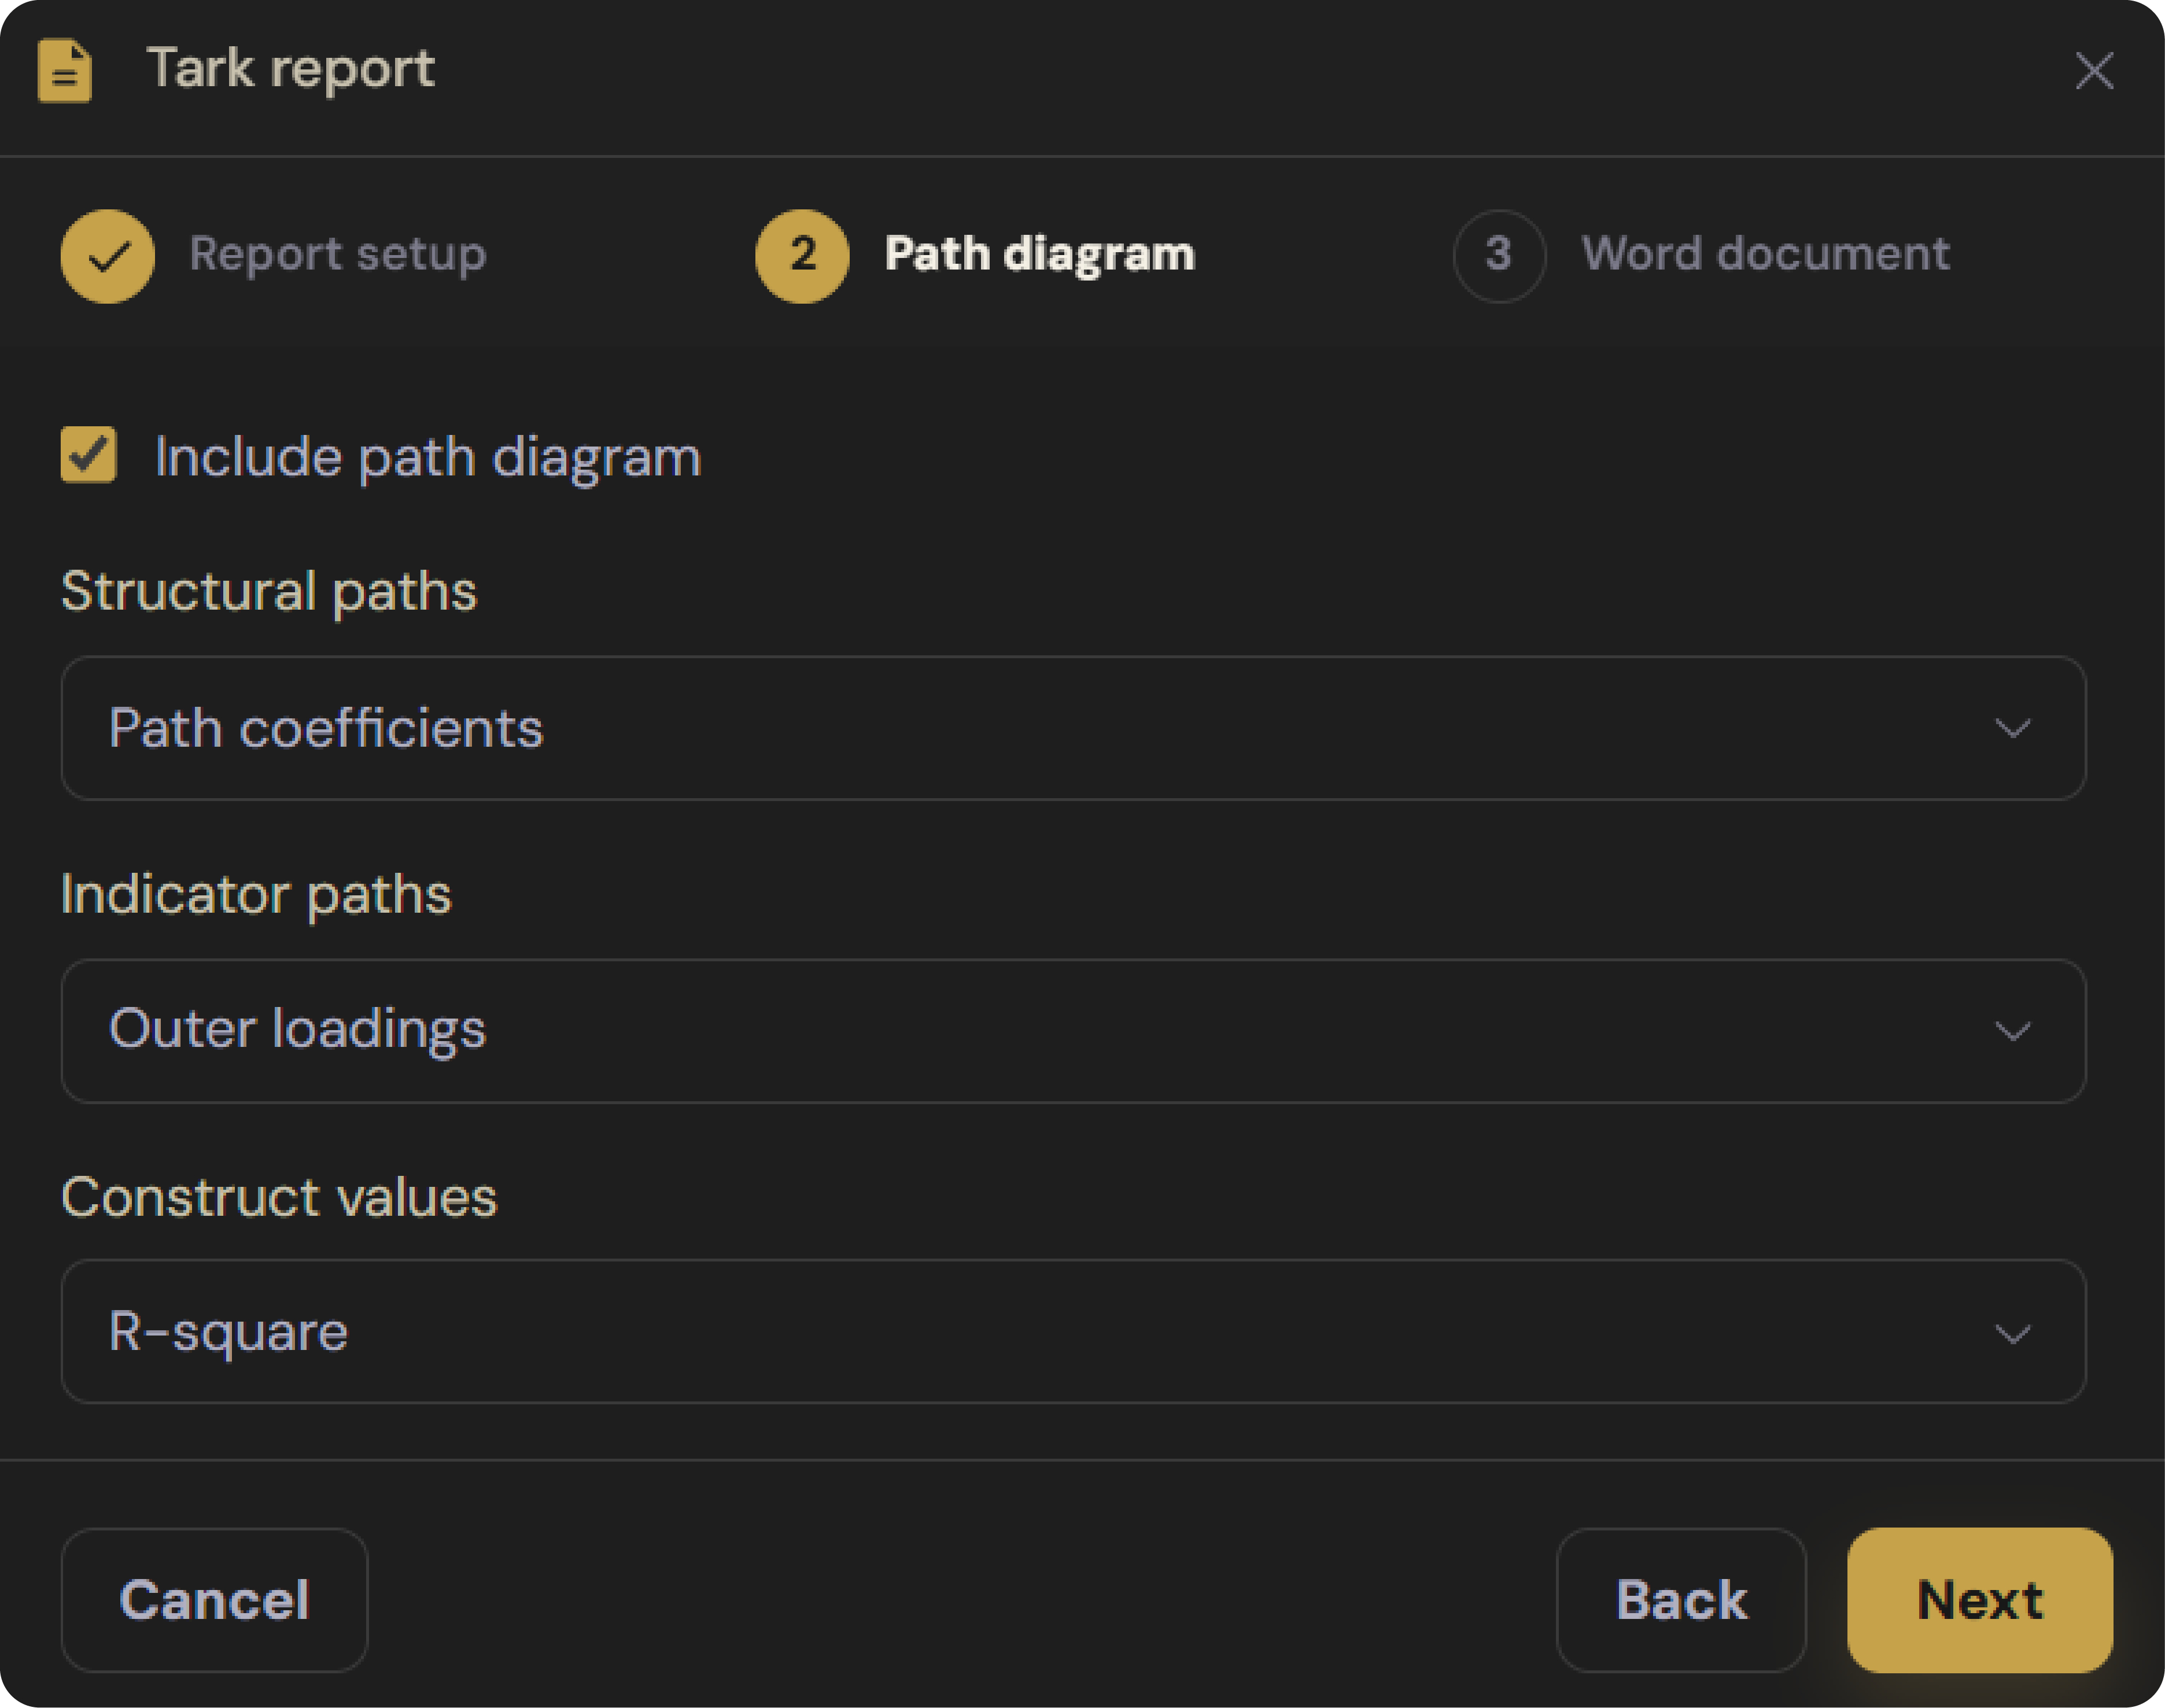
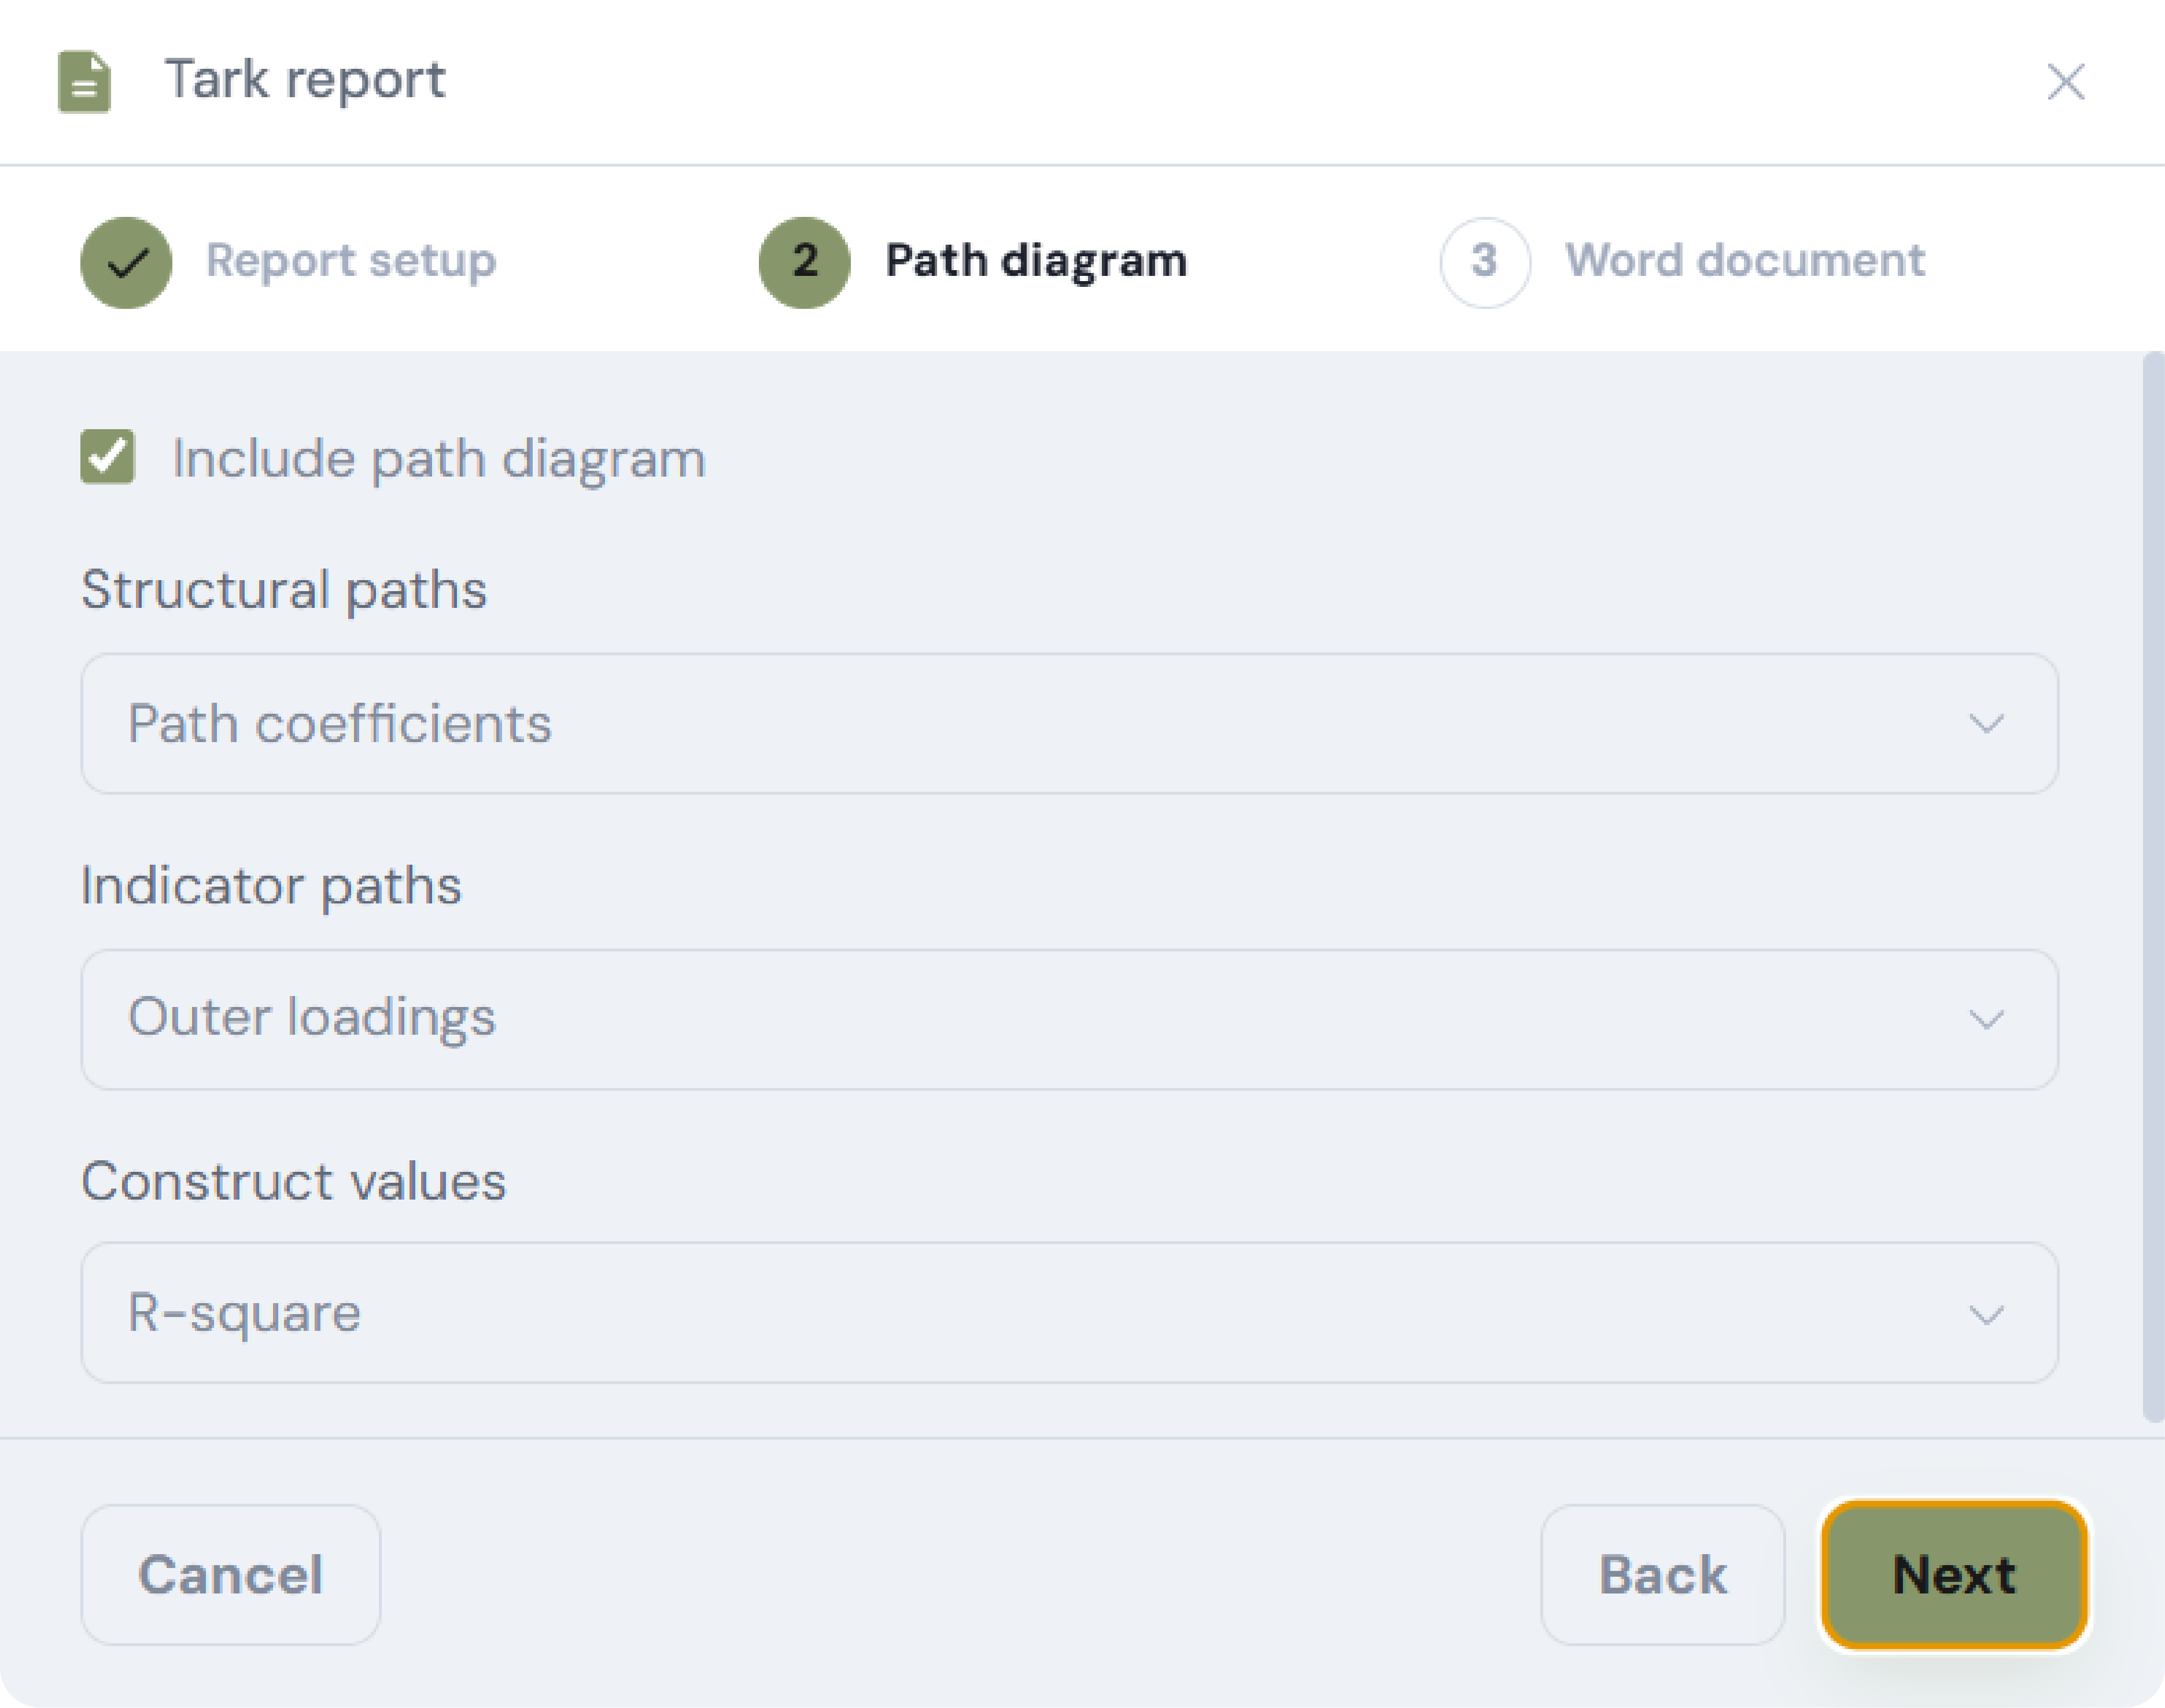
Step 2 — Path Diagram Configuration
Configure the visual layout of your structural model diagram. You can toggle:
- Display of inner structural path coefficients (β) and p-values.
- Display of outer loading (λ) and weight values.
- Construct variance explained (R2 and Adjusted R2) inside node shapes.
- Light or dark vector diagram export theme.
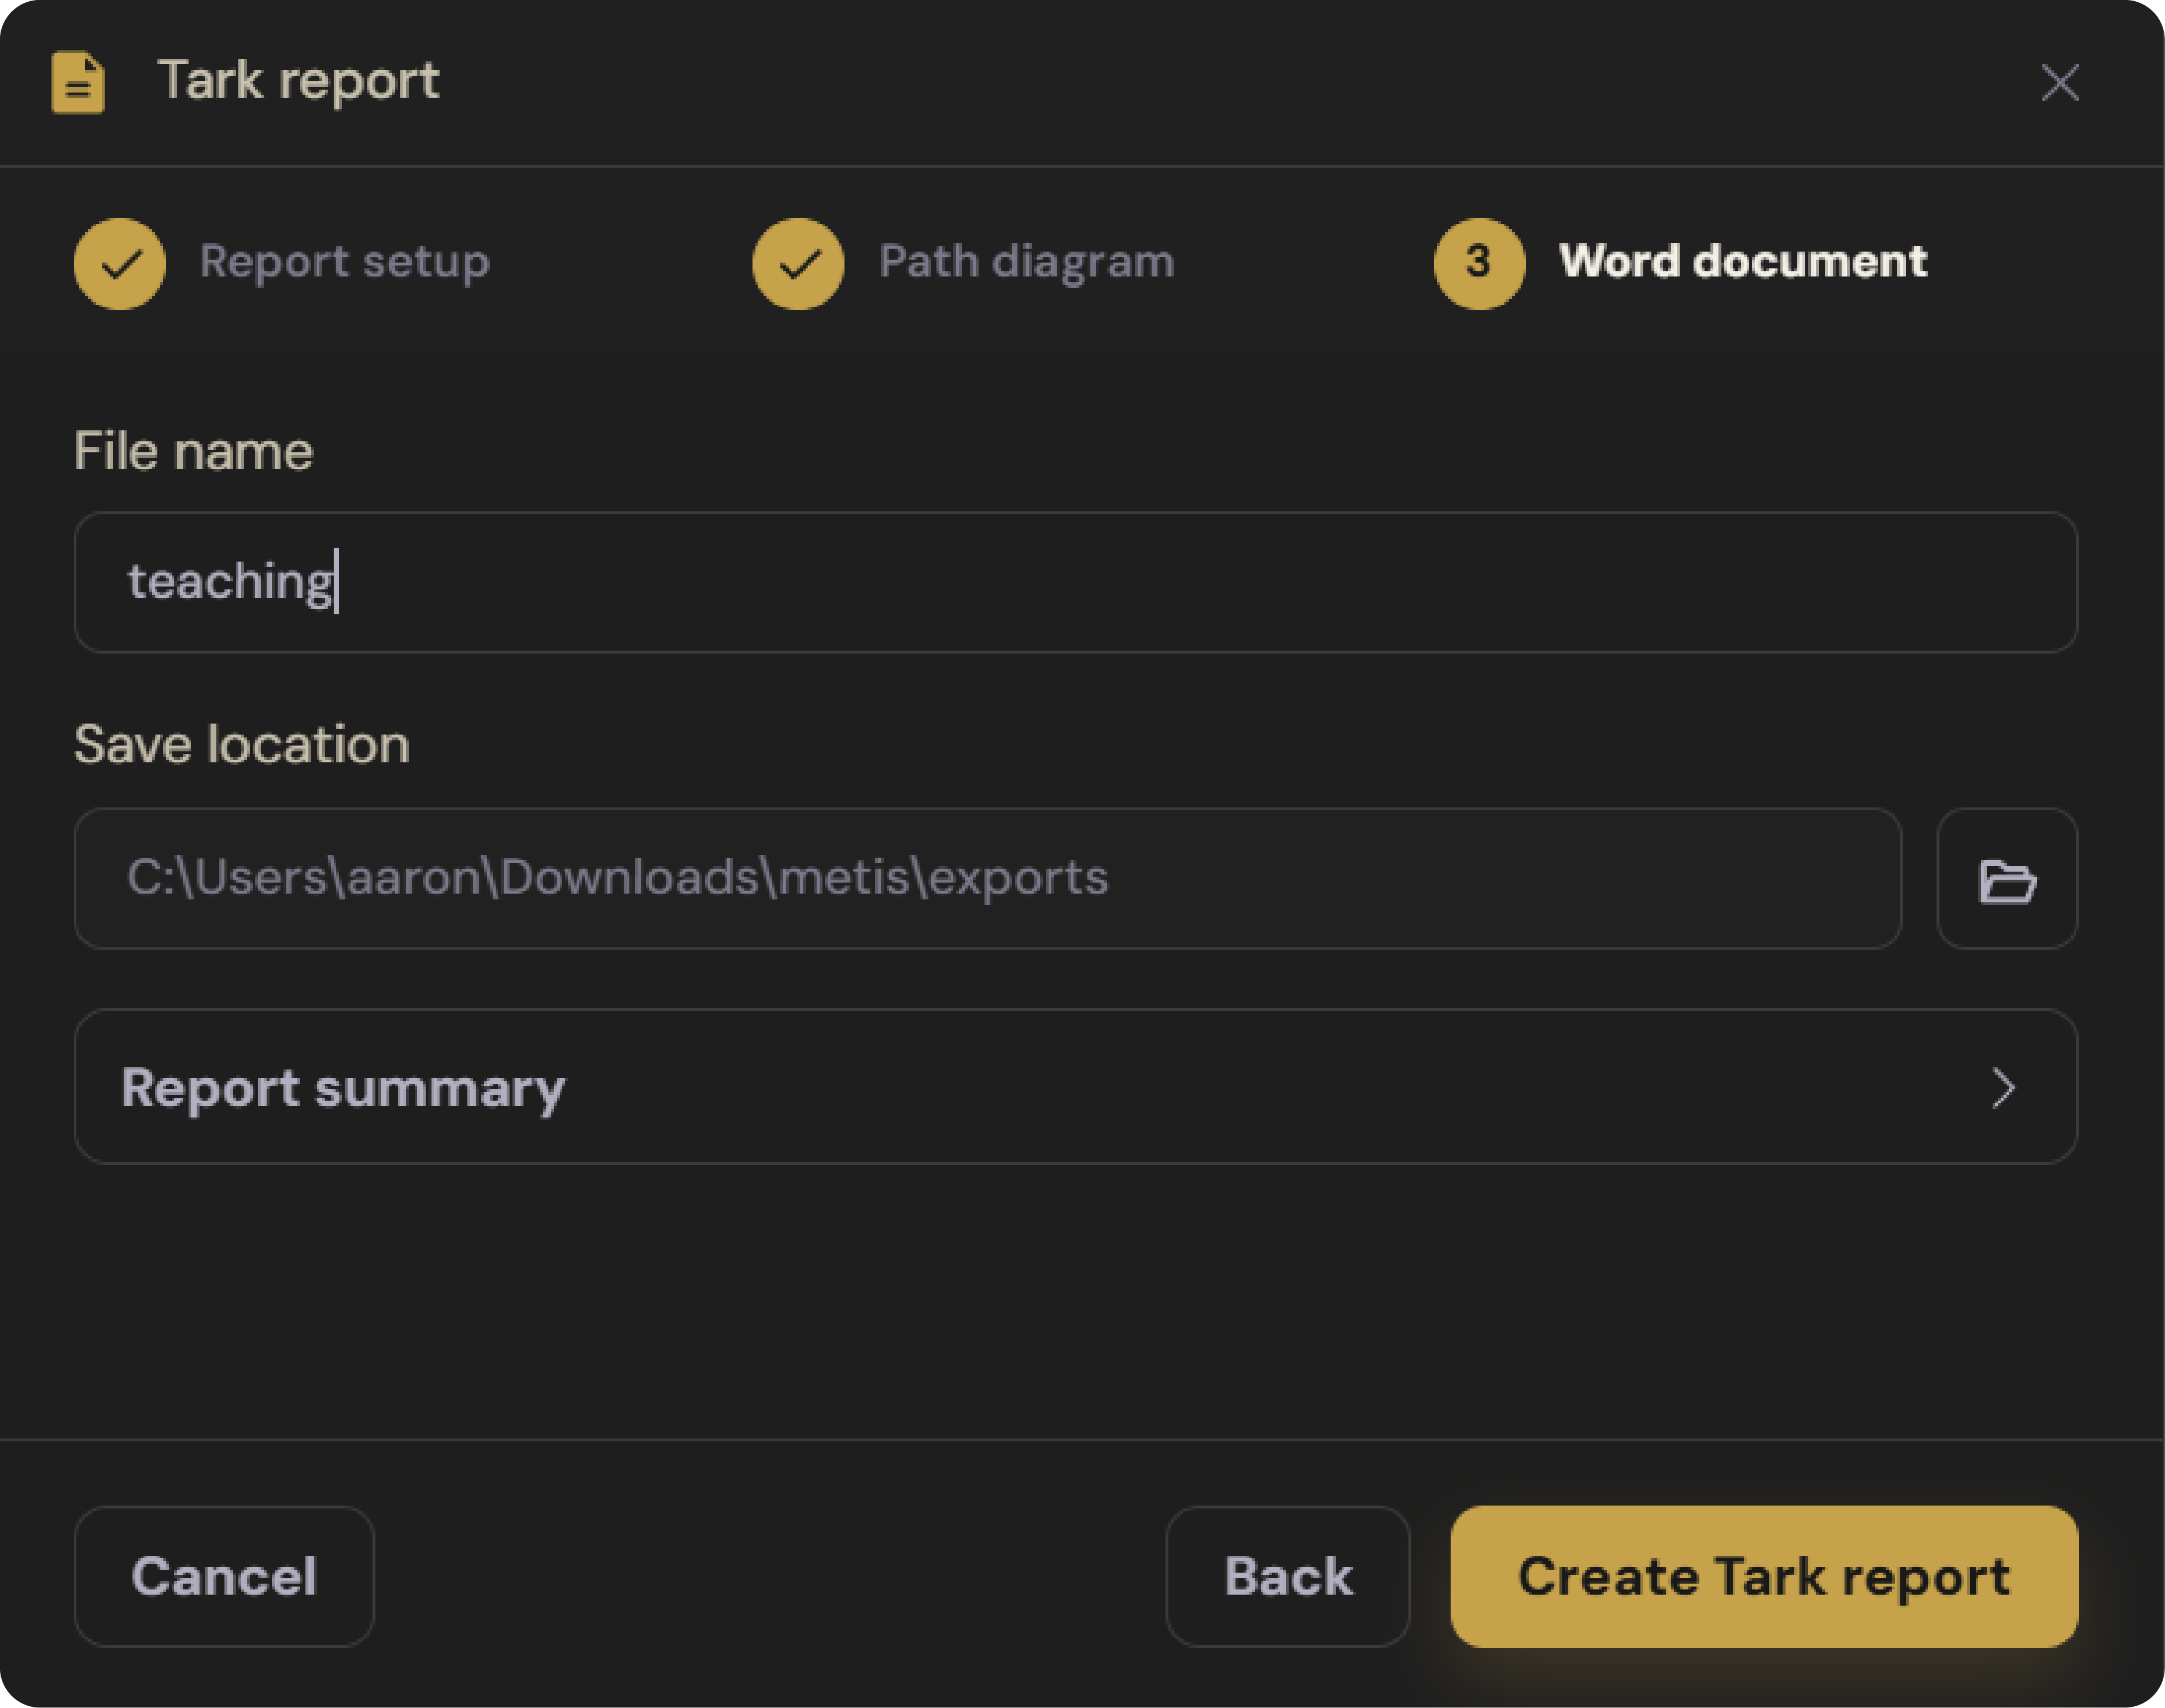
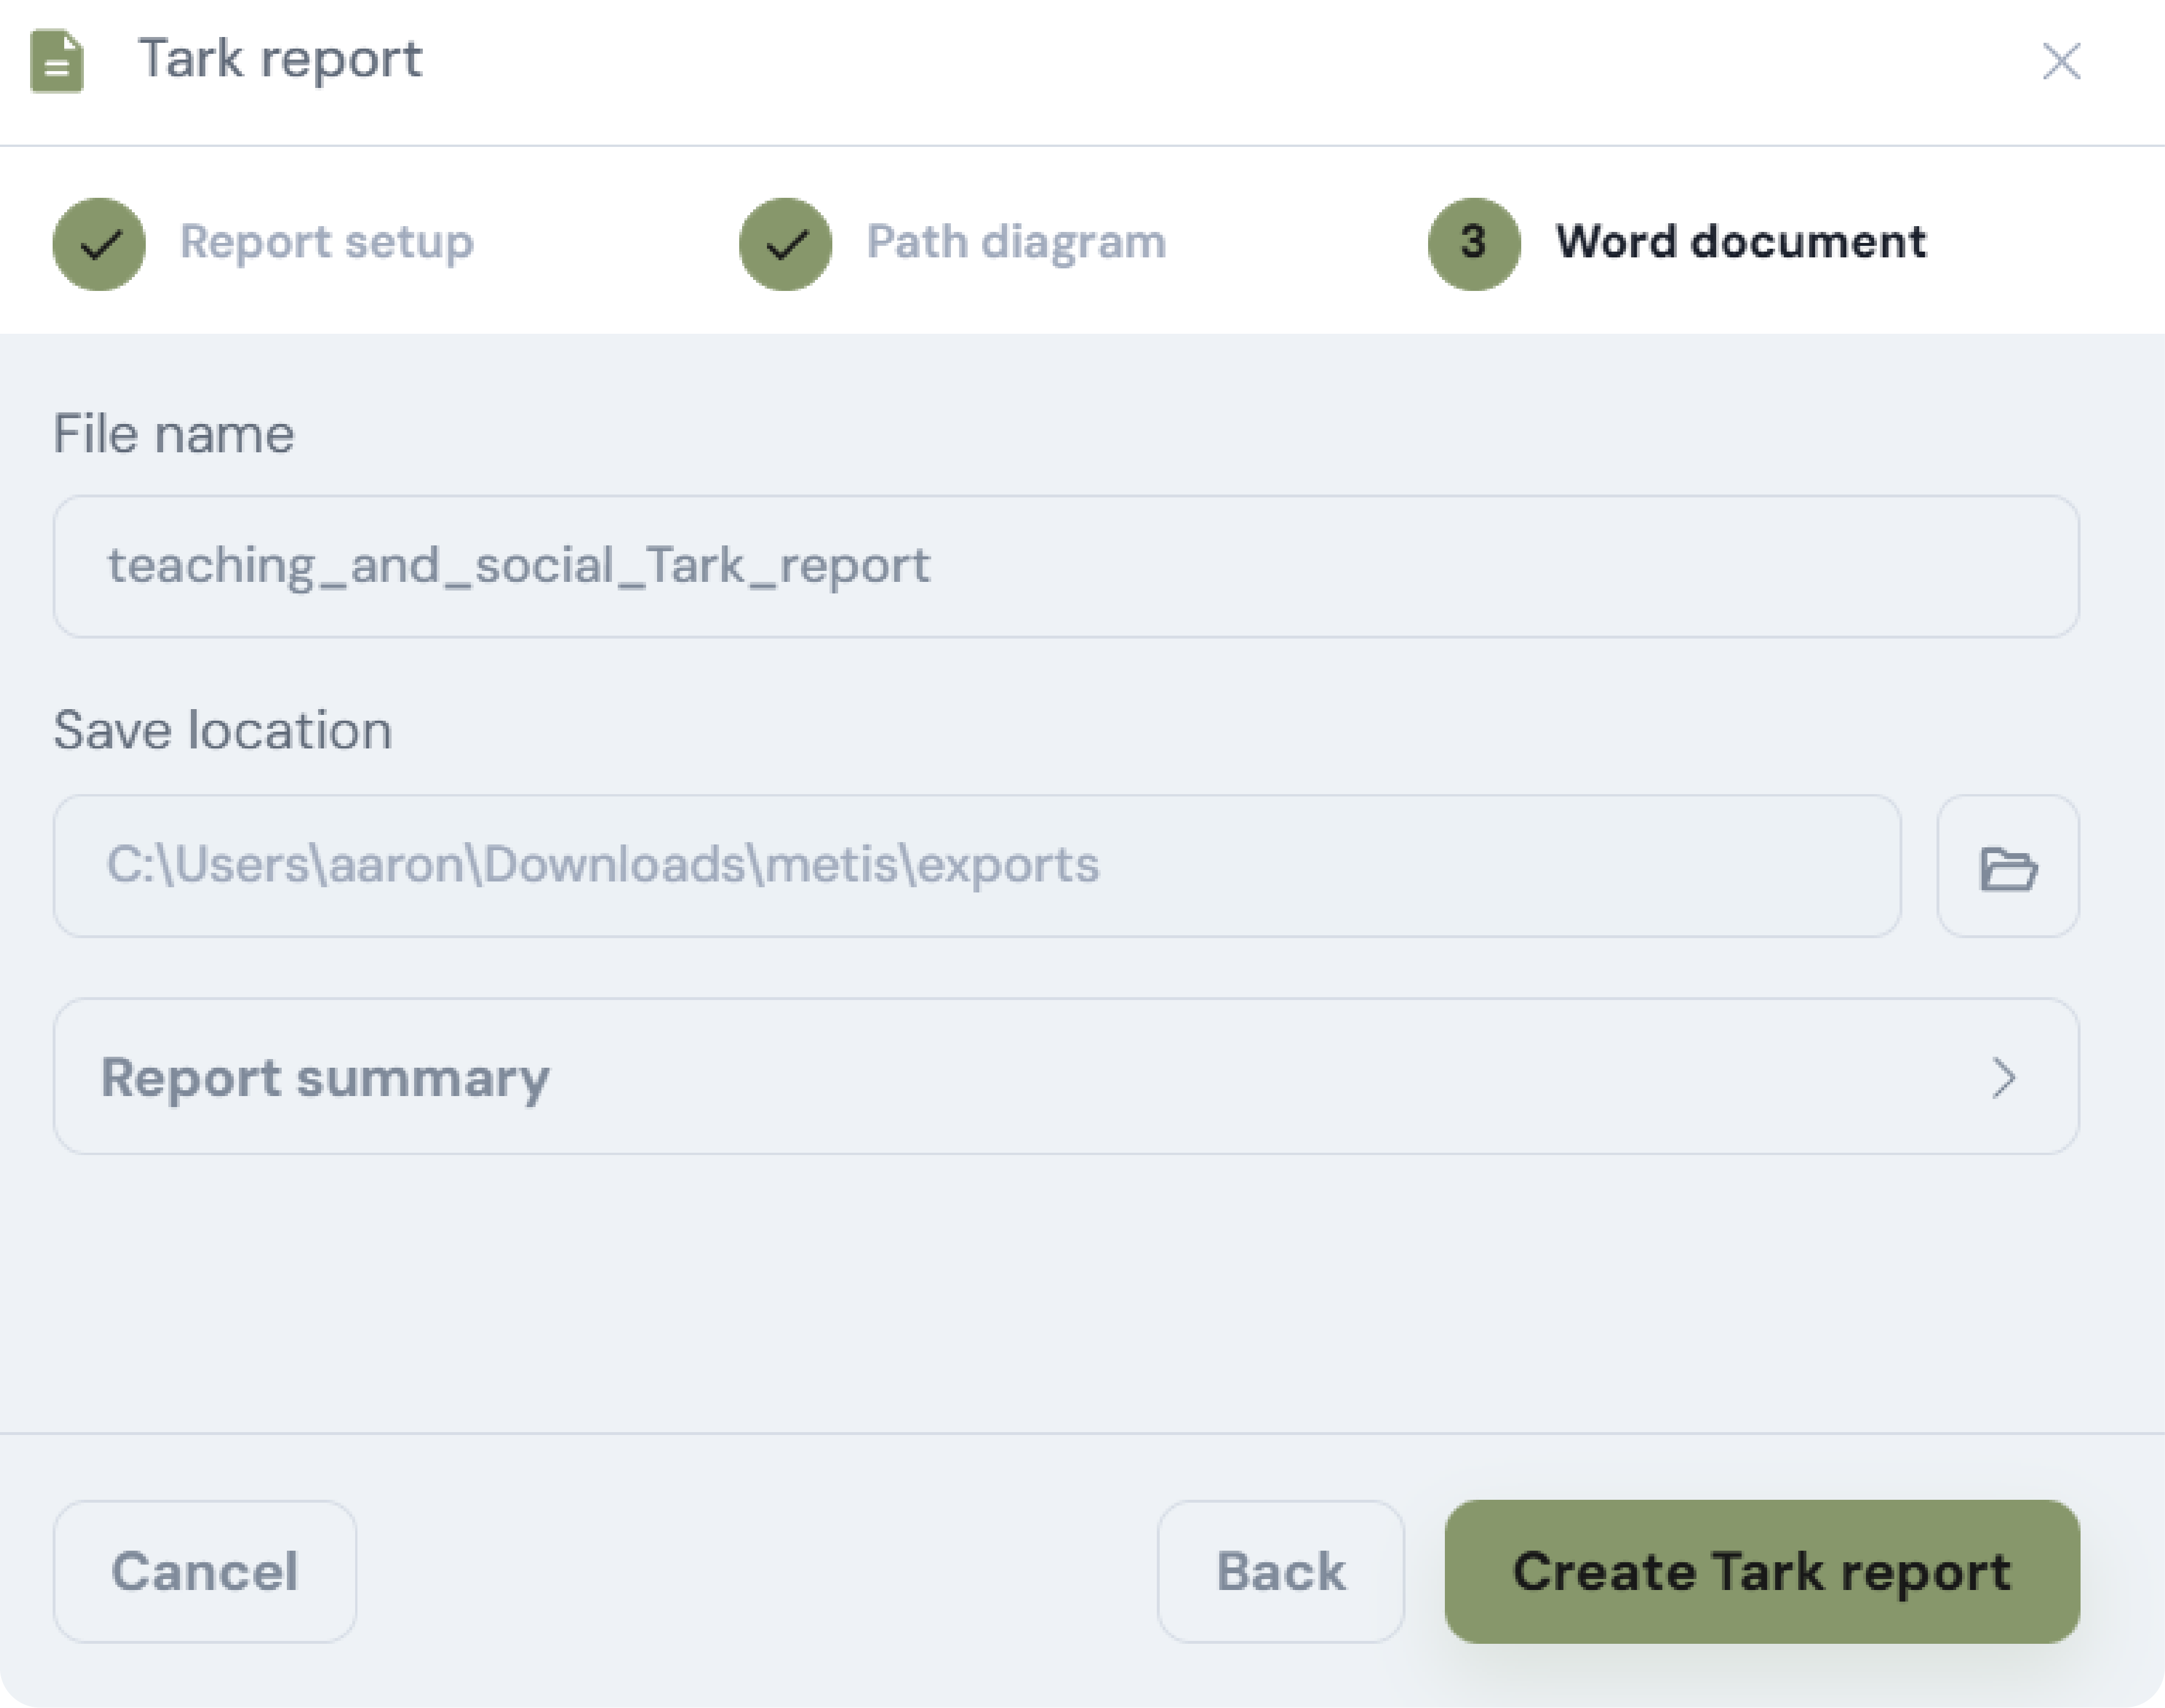
Step 3 — Word Document (.docx) Export
Specify your target export folder and filename. Click Generate Report. Tark generates your .docx document complete with APA 7 formatted tables, embedded vector figures, and automated executive text summaries explaining key statistical decisions.
4. Generated Report Content & APA 7 Tables
Table 1. Measurement Model & Construct Reliability
Reports indicator outer loadings (λ ≥ 0.708), indicator reliability (λ2), Cronbach's α ≥ 0.70, construct reliability (ρa ≥ 0.70, ρc ≥ 0.70), and Average Variance Extracted (AVE ≥ 0.500).
Table 2 & 3. Discriminant Validity Assessment
Includes both the classic Fornell-Larcker criterion matrix (diagonal elements representing √(AVE)) and the modern Heterotrait-Monotrait ratio (HTMT) matrix with 95% bootstrap confidence intervals (HTMT < 0.85 / 0.90).
Table 4. Structural Model & Hypothesis Testing
Presents hypotheses, structural paths (β), standard errors (SE), t-statistics, p-values, 95% bias-corrected confidence intervals, effect sizes (f2), and decision outcomes (Supported / Not Supported).
Table 5. Explanatory & Out-of-Sample Predictive Power
Reports R2, Adjusted R2, Q2predict > 0, and RMSE / MAE comparison against the linear model (LM) benchmark to assess high, medium, or low predictive power (Shmueli et al. 2019).
APA 7 Style Compliance
All Tark tables feature standard APA 7 border rules (top border, header separator, bottom border), italicized statistical symbols (p, t, β, R2, f2), and complete footnotes explaining significance levels (*p < 0.05, **p < 0.01, ***p < 0.001).