Metis MICOM
Measurement Invariance for Composite Models (MICOM) in Partial Least Squares Structural Equation Modelling (PLS-SEM).
1. Overview & Development Background
Multigroup Analysis (MGA) allows researchers to test whether structural relationships differ across distinct sub-populations, such as gender, country, or user experience tiers. However, comparing group path coefficients is only valid if the underlying constructs are measured identically across groups—a requirement known as measurement invariance.
In composite-based structural equation modeling, the Measurement Invariance of Composites (MICOM) procedure (Henseler et al. 2016; Hair et al. 2018) is the standard protocol for establishing measurement invariance before conducting MGA.
While the R package seminr provides a powerful domain-specific language for estimating PLS-SEM models and multigroup comparisons (estimate_pls_mga), it historically lacked native MICOM implementation. Users requiring measurement invariance evidence had to re-specify and re-estimate their models in separate environments like cSEM or commercial software. Metis MICOM closes this gap by implementing MICOM directly on seminr model objects.
Development of Metis MICOM focused on three core engineering goals:
- Single Model Pipeline: Estimate, test measurement invariance, and execute multigroup comparisons on a single model object within Metis app.
- Mathematical Rigor: Deterministically resolve composite sign indeterminacy and track permutation admissibility for non-convergent or out-of-bounds re-estimations.
- Empirical Validation: Rigorously cross-verify results against
cSEM::testMICOMacross 54 datasets spanning diverse empirical survey conditions.
2. The 3-Step MICOM Procedure
Metis MICOM executes the three-step invariance protocol established by Henseler et al. (2016):
Step 1 — Configural Invariance
Configural invariance is a qualitative check confirming that both groups share identical model specifications, indicator definitions, data treatment, and algorithm settings. Metis MICOM automatically verifies:
- Presence of the selected grouping variable and valid categorical values.
- Sufficient observation counts in both group subsets (min 20 observations per group).
- Identical indicator assignments and composite weighting modes (Mode A or Mode B).
- Identical inner and outer model estimation parameters.
Step 1 returns a structured diagnostic table without a p-value. A failure halts the procedure to prevent invalid calculations.
Step 2 — Compositional Invariance
Compositional invariance tests whether outer weights form equivalent composite scores across groups. For each construct, Metis MICOM calculates composite scores on the standardized dataset using Group A weights and Group B weights, then computes the correlation statistic c:
c = cor( Y_a(W_a), Y_a(W_b) )
A value of c = 1.0 indicates that the composite score is formed identically regardless of group-specific weight estimates. A non-parametric permutation test reshuffles group labels (defaulting to 1,000 permutations; 5,000 recommended for reporting), re-estimates group models, and forms a reference distribution of permuted c statistics.
Compositional invariance is supported when the empirical c statistic is not significantly lower than the 5% quantile (c_0.05) of the permutation distribution (p ≥ 0.05).
Step 3 — Equality of Composite Means & Variances
When Steps 1 and 2 are supported, partial measurement invariance is established, permitting valid comparisons of standardized path coefficients across groups. Step 3 evaluates full measurement invariance by comparing construct score means and log variances on the pooled dataset:
- Mean Equality: Evaluates observed mean difference
| Mean(Y_a) - Mean(Y_b) |against the permutation reference distribution. - Variance Equality: Evaluates log variance difference
| ln(Var(Y_a)) - ln(Var(Y_b)) |against the permutation reference distribution.
If Step 3 also holds (p ≥ 0.05 for both tests), full measurement invariance is established, allowing comparison of unstandardized construct parameters and mean levels.
3. Validation against cSEM Benchmark
To establish scientific confidence, Metis MICOM was benchmarked against cSEM::testMICOM across 54 empirical survey datasets (available to download the complete benchmark dataset) covering real-group splits, bootstrap resamples, null permutations, and merged dataset cases under both Mode A (reflective/correlation weights) and Mode B (formative/regression weights).
Cross-Verification Results
| Evaluation Metric | Mode A (Correlation Weights) | Mode B (Regression Weights) |
|---|---|---|
| Statistic Mean Abs. Difference | 0.0023 | 0.0084 |
| Statistic within 0.02 Margin | 97.4% | 87.6% |
| Step 2 Decision Concordance | 97.4% | 94.7% |
| Step 3 Mean Equality Agreement | 100.0% | 100.0% |
| Step 3 Variance Equality Agreement | 99.0% | 99.0% |
Deterministic Sign Alignment
Composite scores in PLS-SEM are identified only up to sign (+1 or -1). Unaligned group composites can arbitrarily resolve to opposite signs, driving their correlation toward -1.0 and falsely reporting non-invariance on valid null cases. Metis MICOM aligns all permuted composite vectors to a group-independent reference matrix prior to computing c. In our validation benchmarks, Metis successfully resolved false-negative sign artifacts where cSEM falsely rejected invariance due to unaligned signs.
Permutation Admissibility Tracking
During permutation testing, non-convergent estimations or out-of-bounds loading estimates can occur. Metis MICOM automatically filters non-convergent or inadmissible draws and records per-construct admissibility metrics in an admissibility data frame so researchers can report exact drop rates in their methodology sections.
4. Using Metis MICOM in Metis Desktop App
Executing a permutation-based measurement invariance analysis in Metis desktop app involves four intuitive steps:
Step 1 — Launch Permutation Analysis
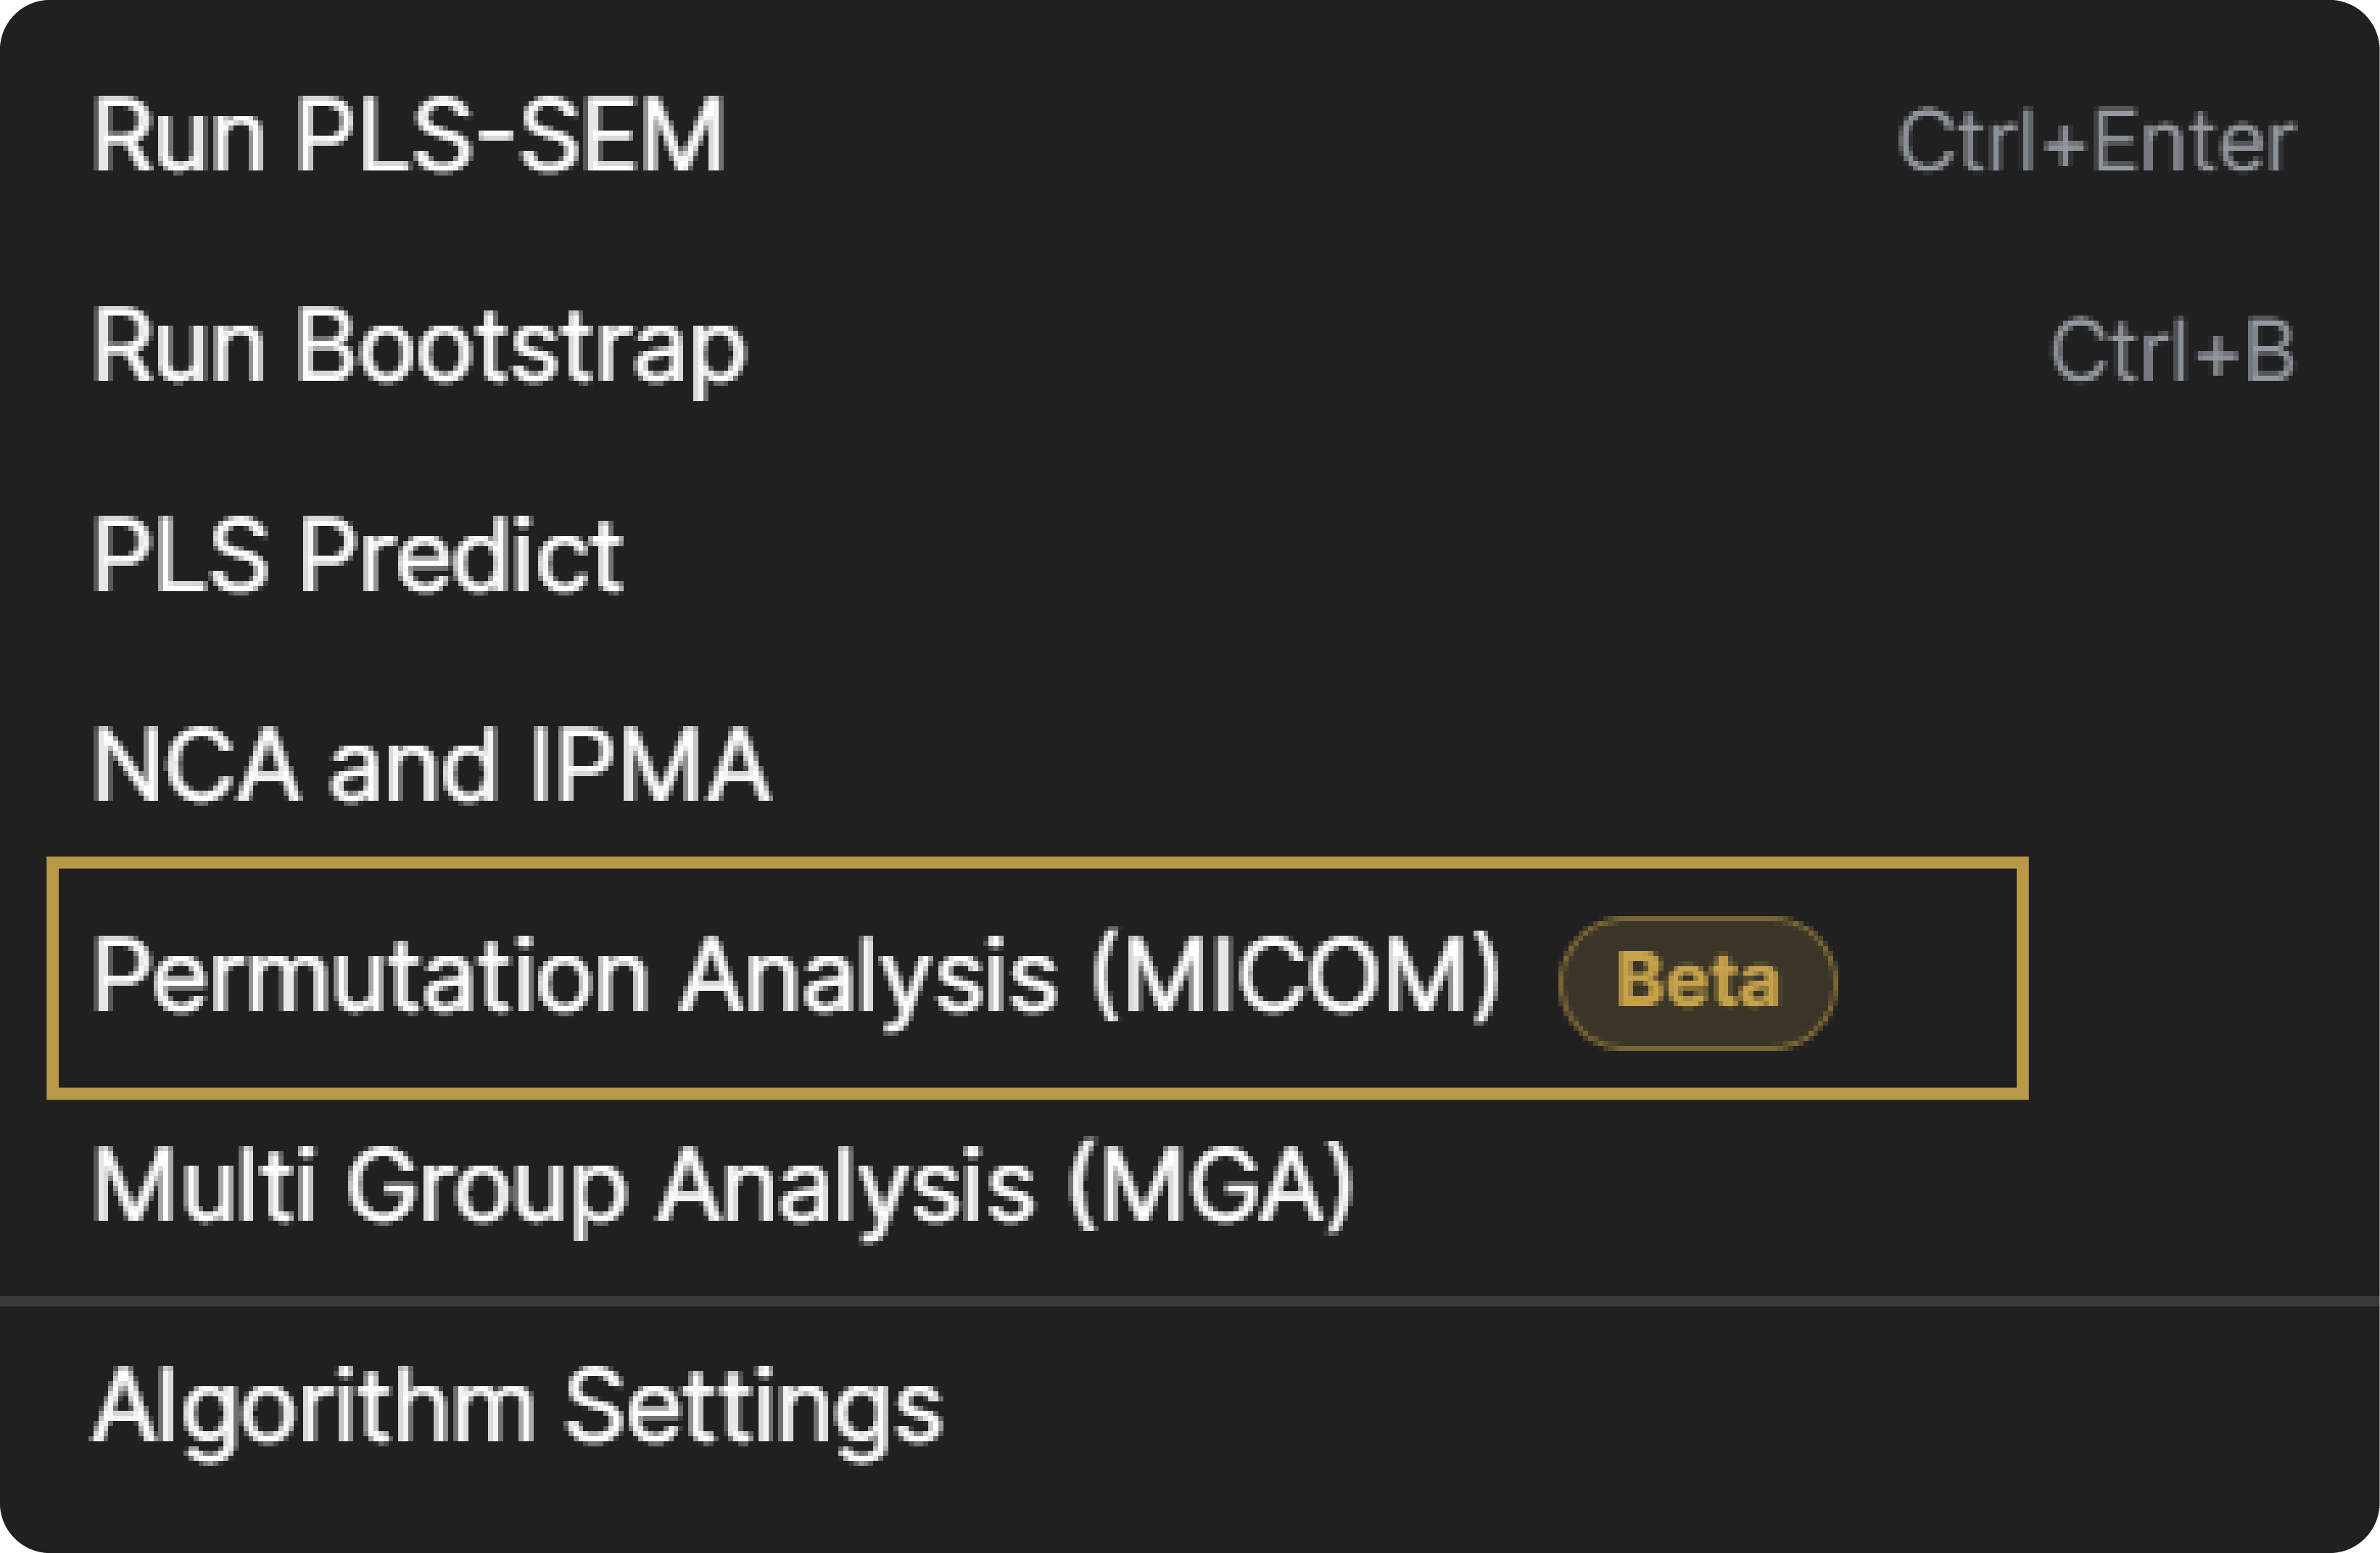
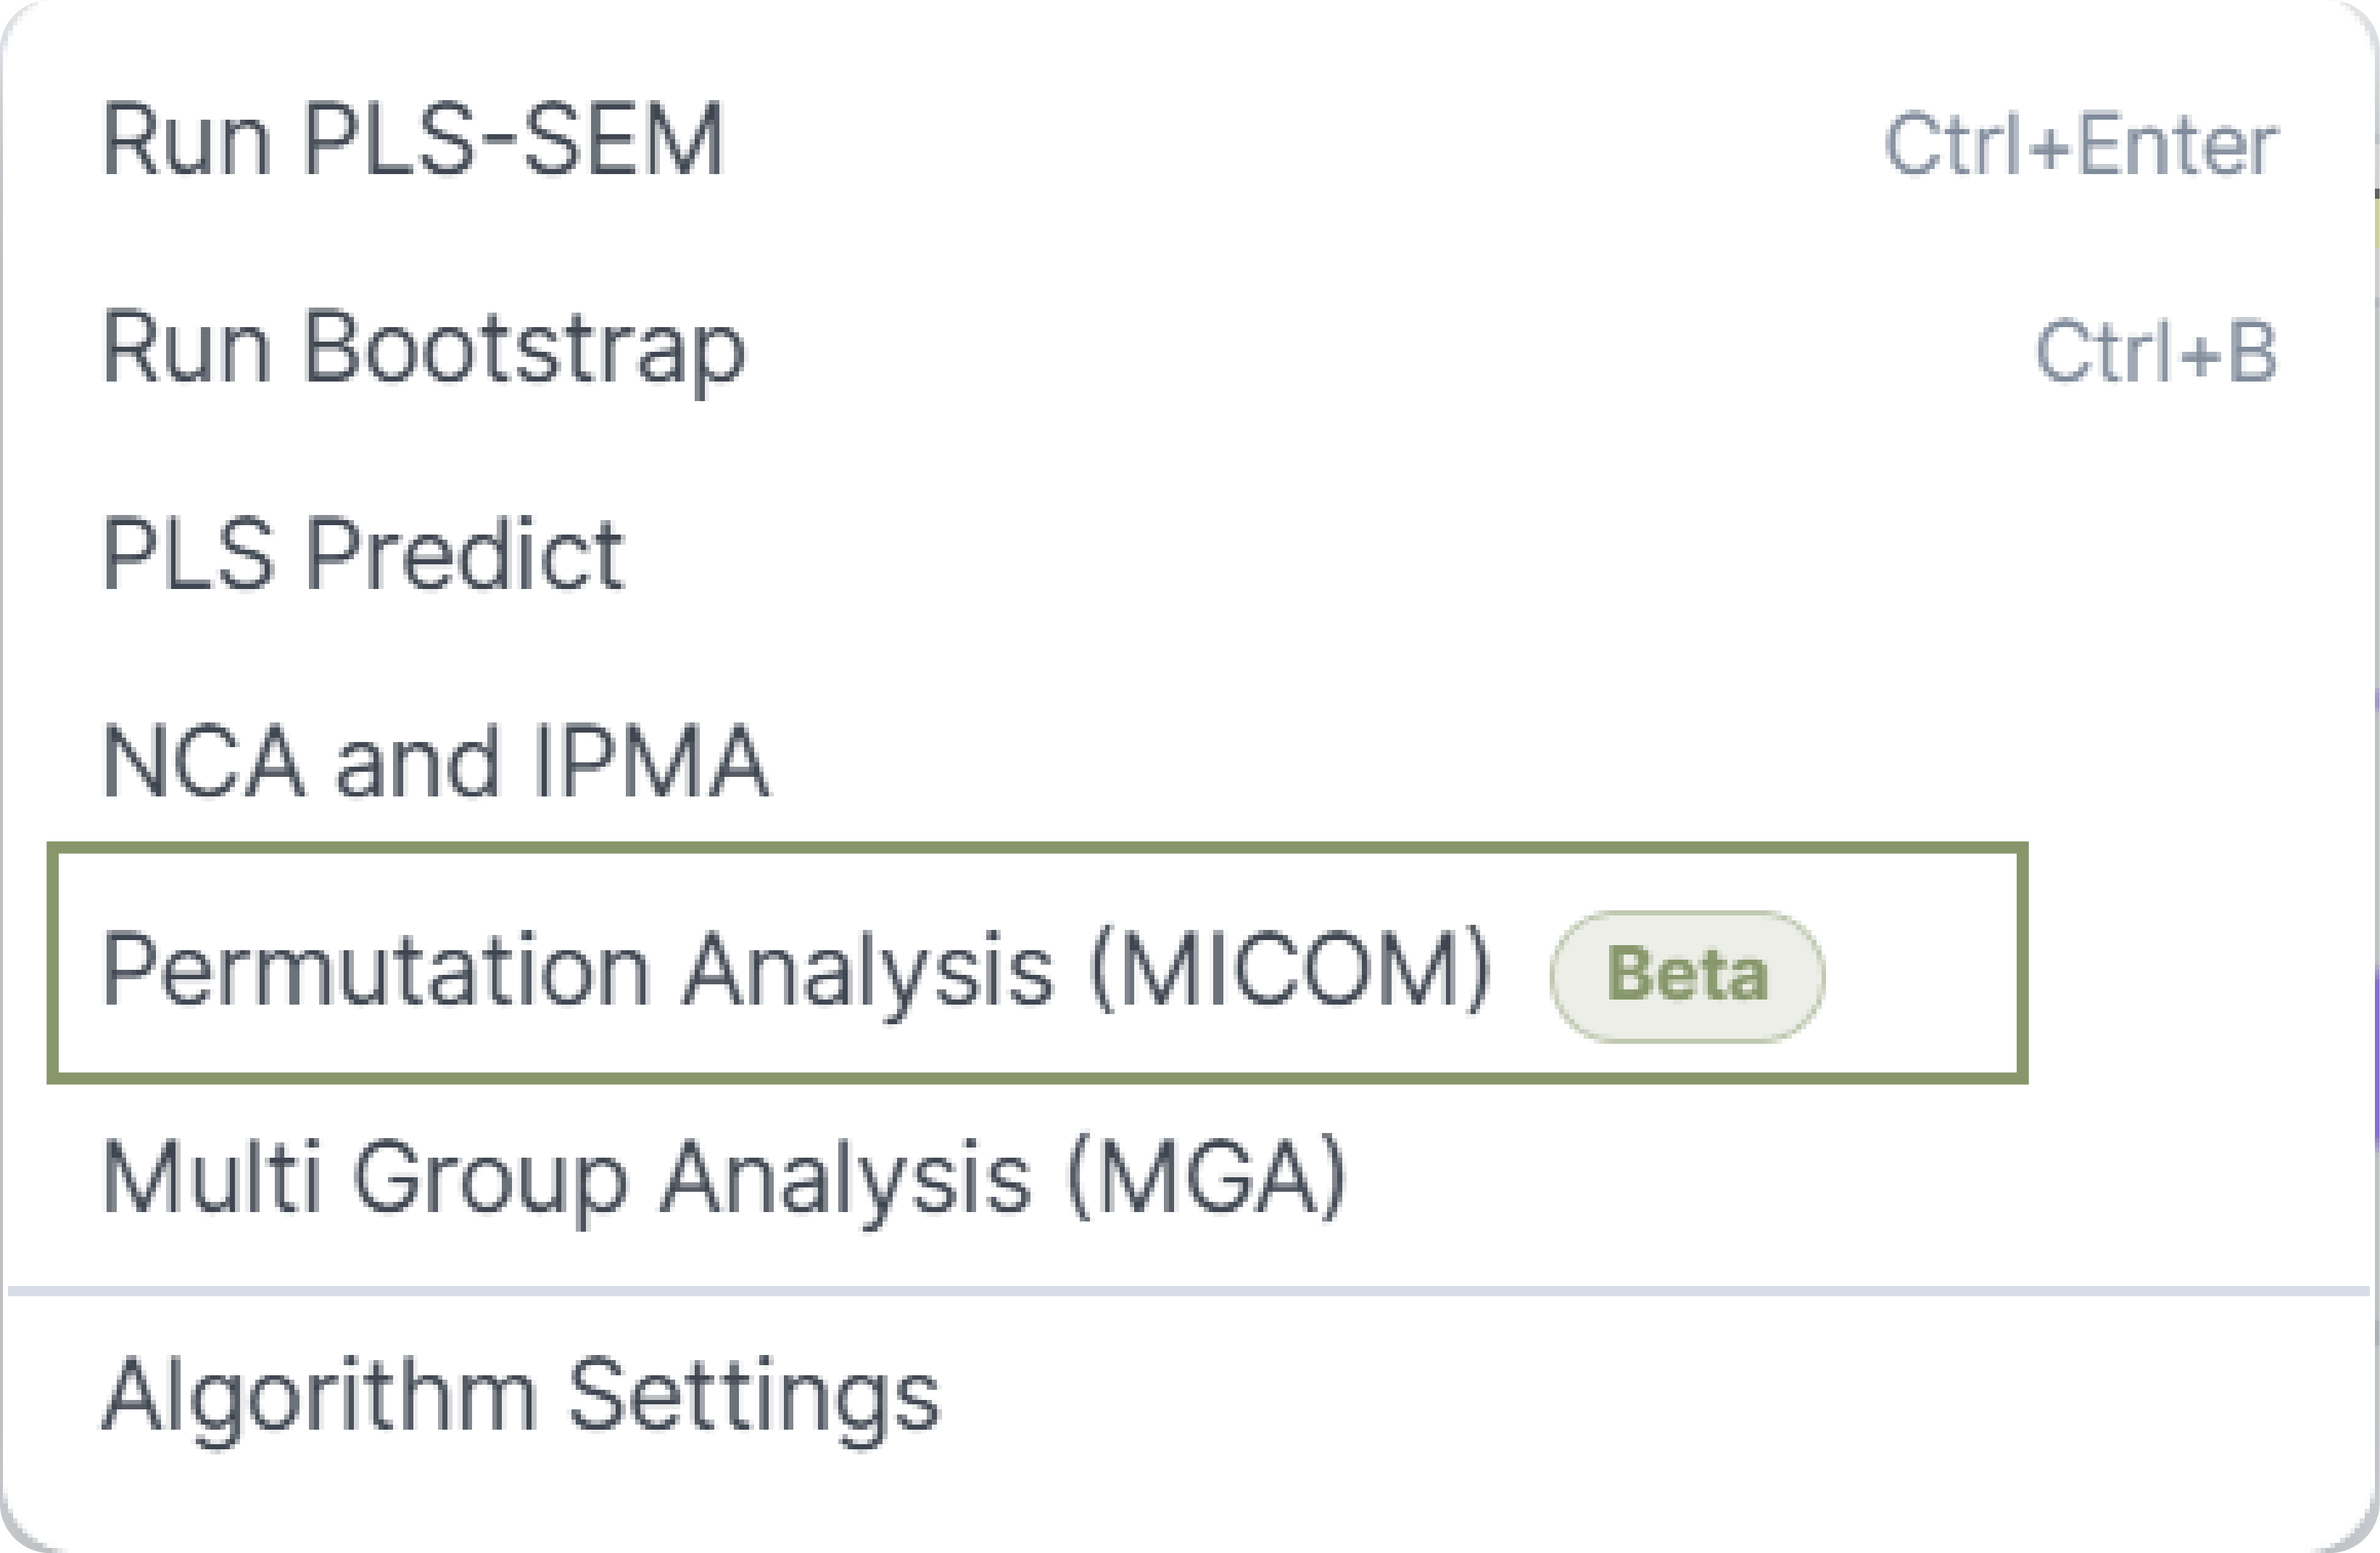
Open your active .metisws workspace with an estimated PLS-SEM model. From the top application menu bar, navigate to:
Analysis → Permutation Analysis (MICOM) [Beta]
Step 2 — Configure Group Mapping & Configural Precheck
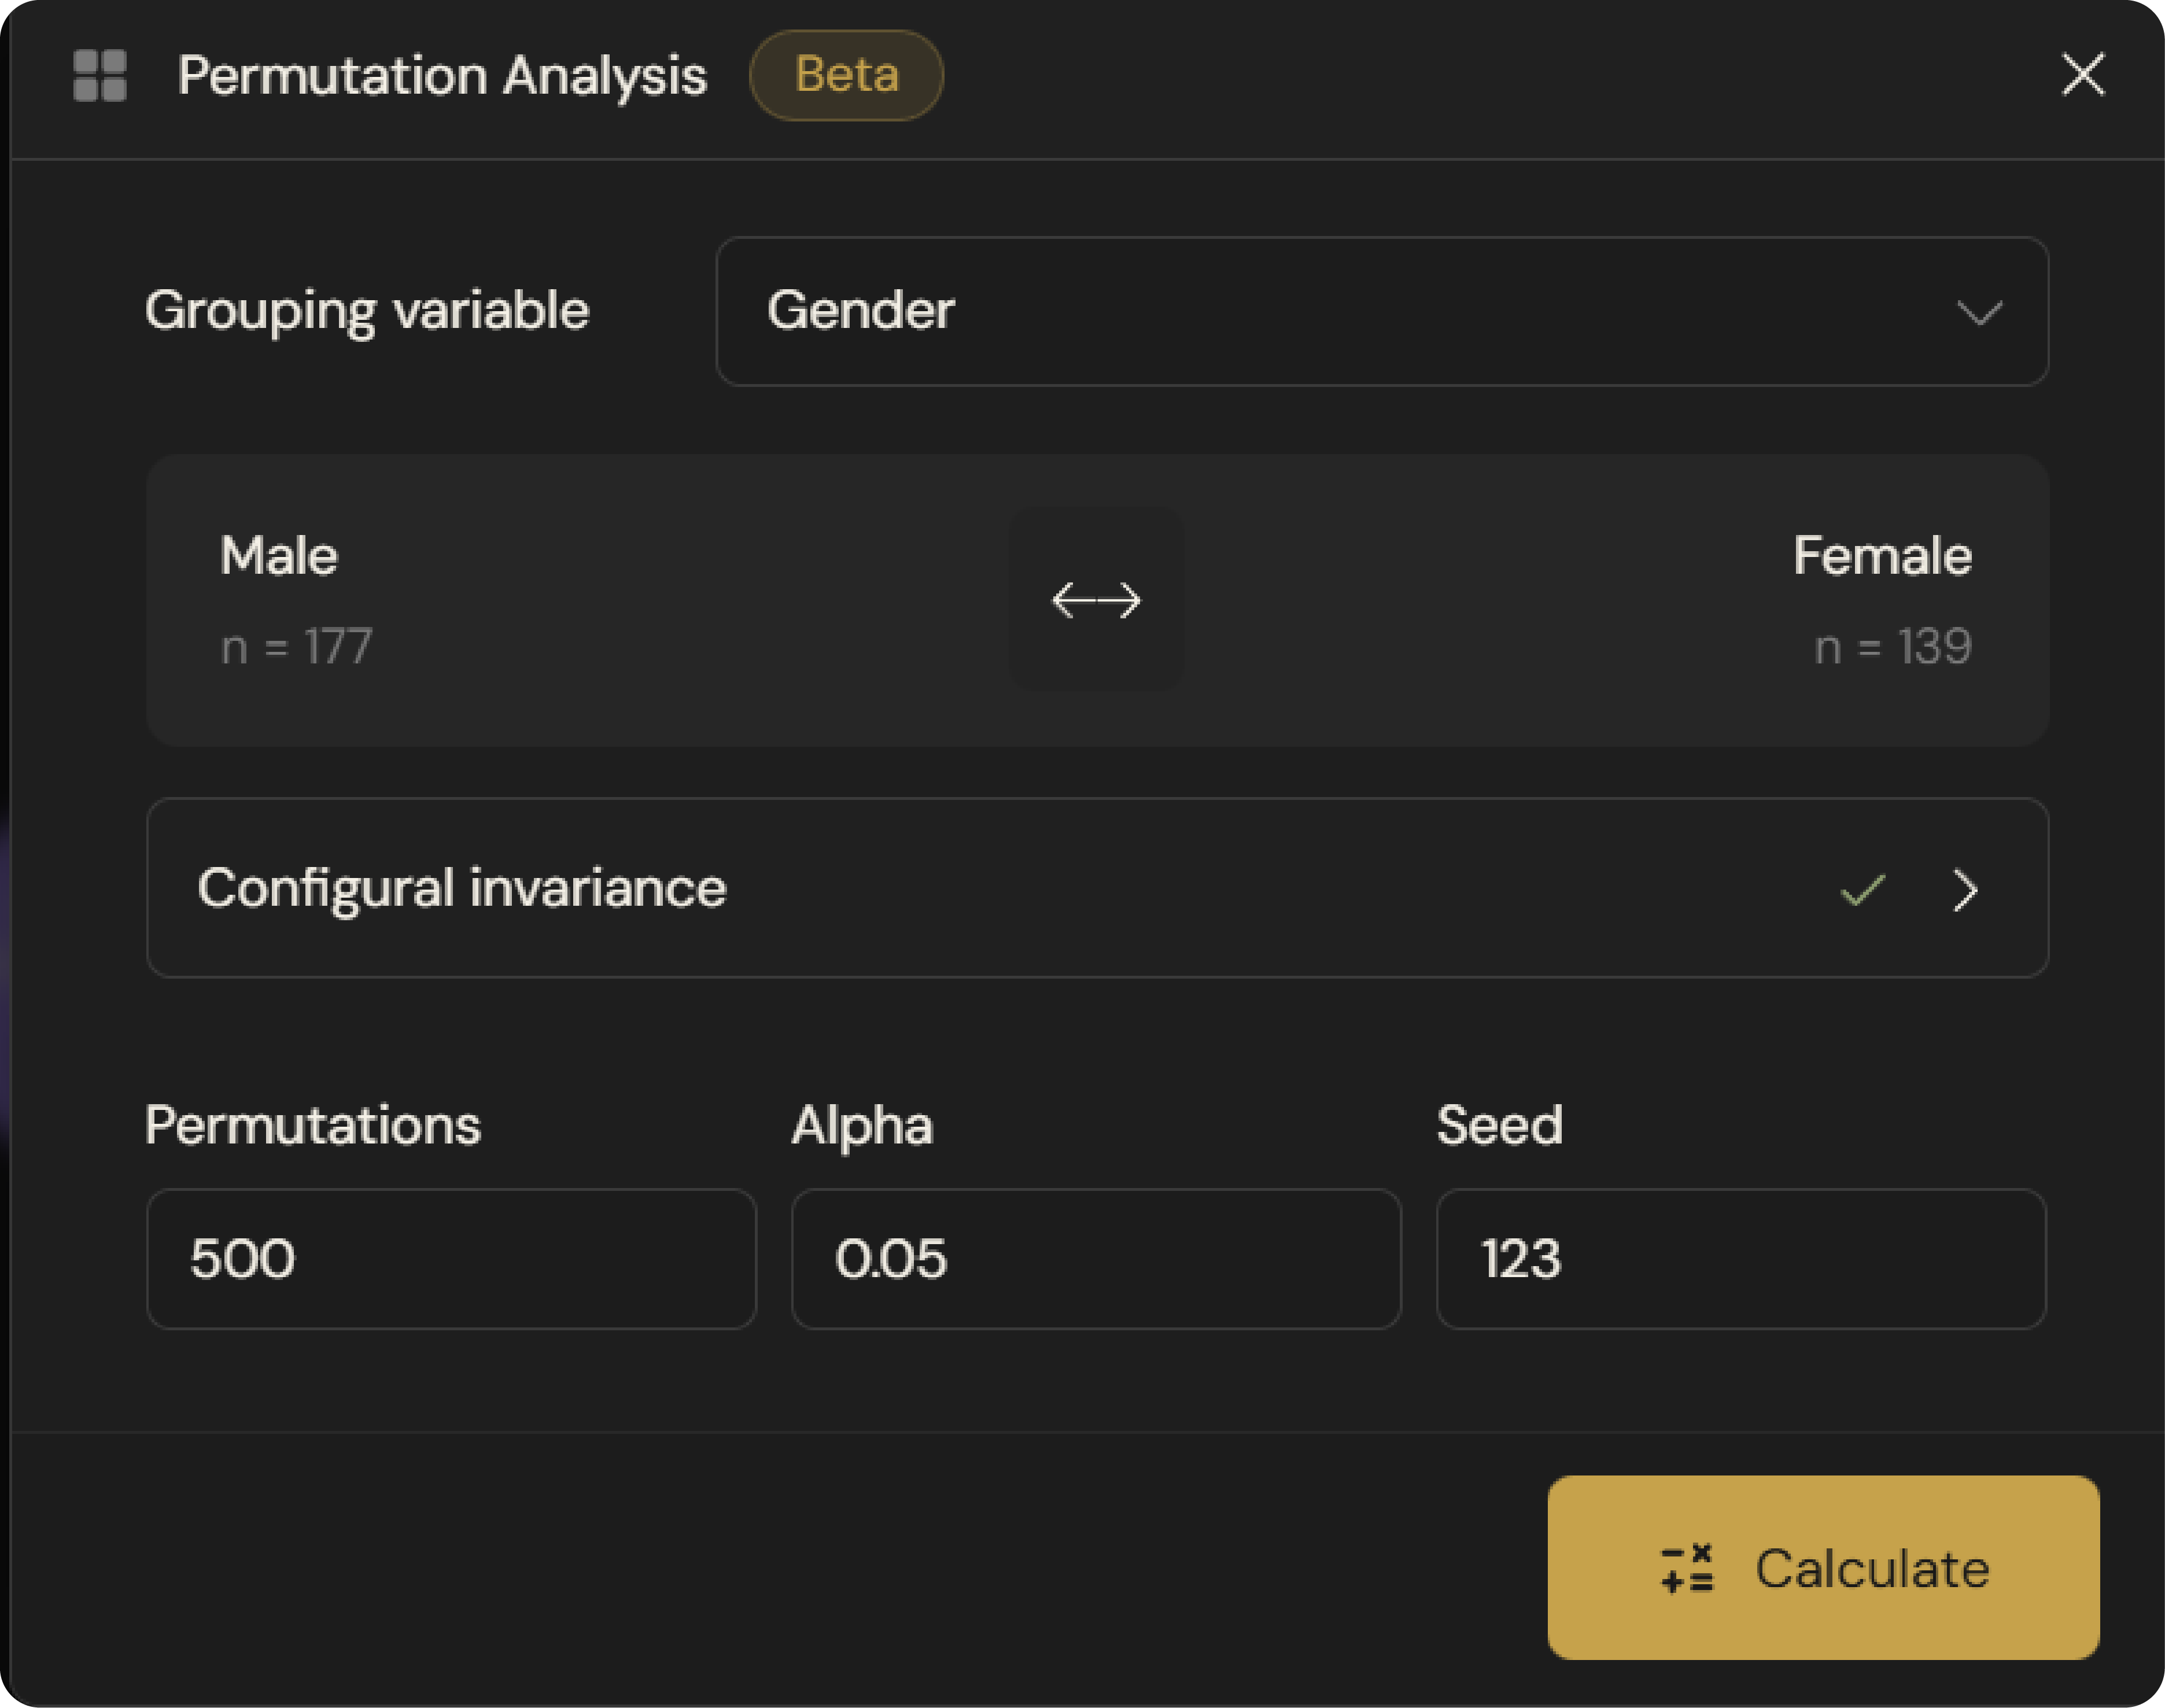
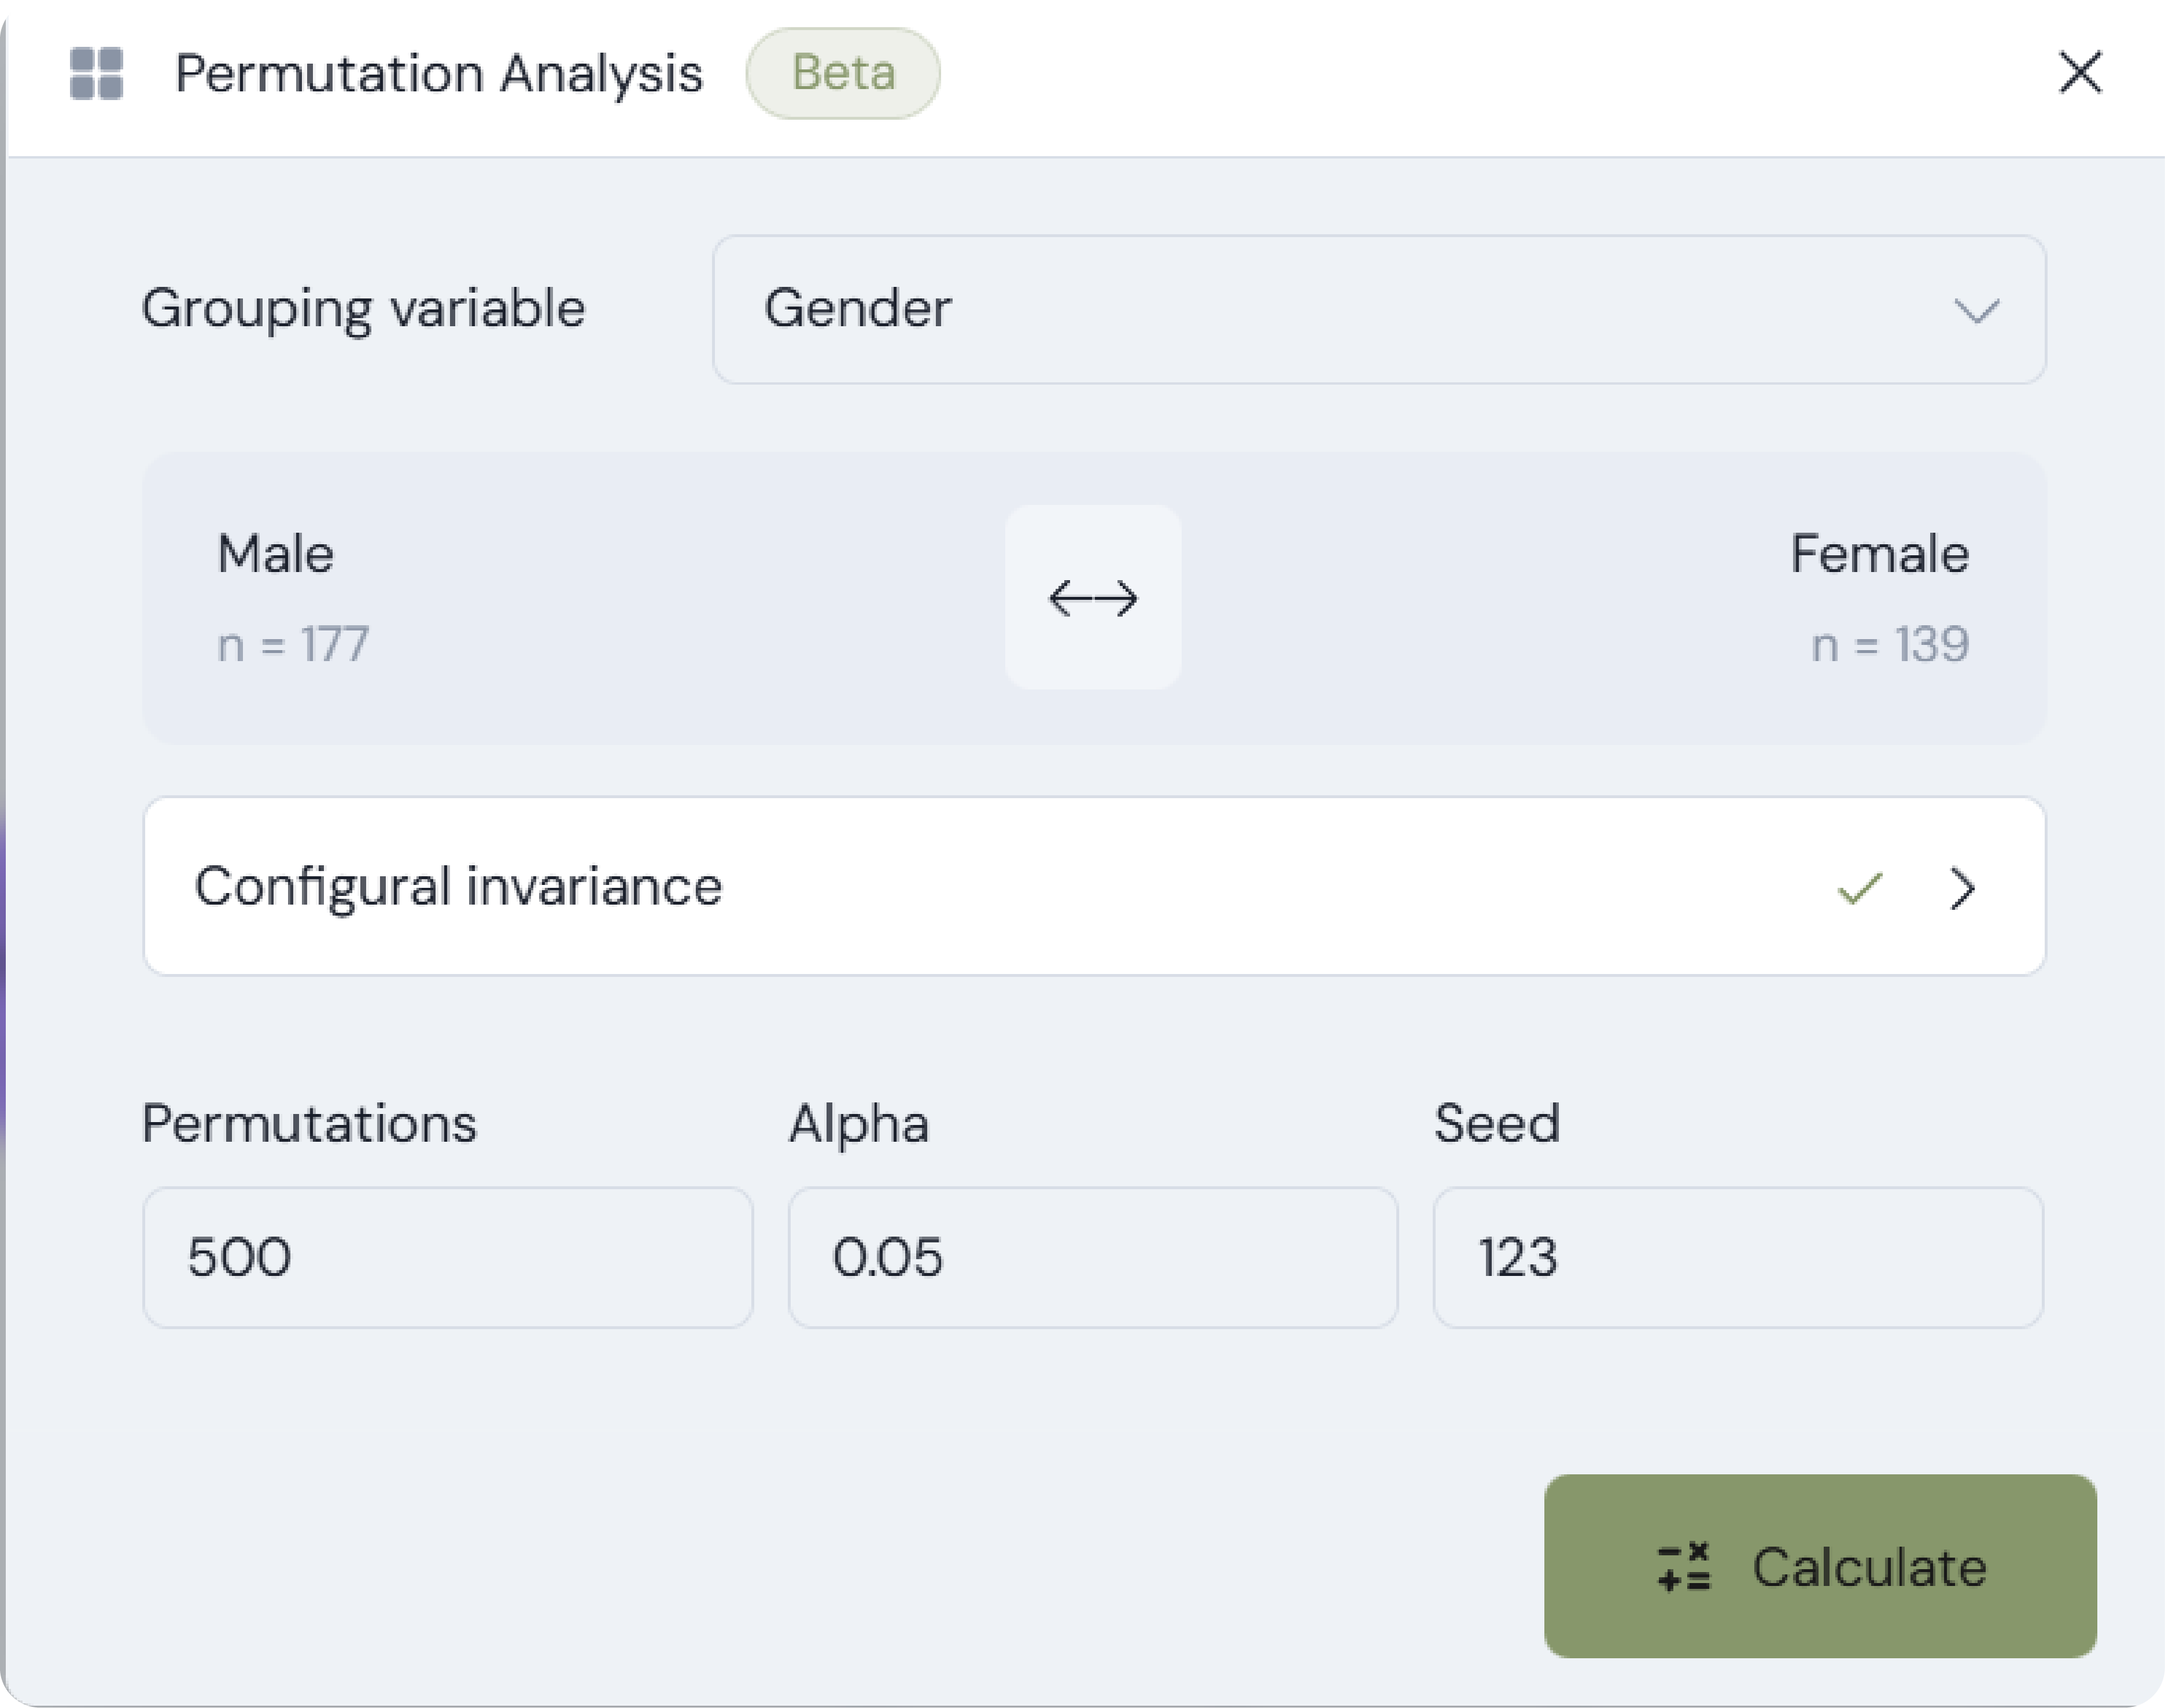
The Permutation Analysis modal opens over your active workspace. Select your grouping variable (e.g. Gender or Country) from the dataset dropdown menu.
Step 3 — Set Execution Parameters & Parallelization
Specify estimation parameters for the non-parametric permutation test:
- Permutation Draws: Set to
1,000(quick check) or5,000(recommended for thesis & journal reporting). - Significance Level (α): Default
0.05(5% two-tailed quantile). - Random Seed: Fixed seed (e.g.
123) for exact reproducible calculations across computers. - Parallel Acceleration: Automatically distributes permutation draws across all CPU threads via multi-worker PSOCK cluster backend, accelerating calculations up to 4×.
Step 4 — Review ResultsView & Invariance Summary
Once calculation completes, Metis automatically opens the Permutation ResultsView. Navigate between detailed diagnostic panels using top tab buttons.
5. Metis MICOM Report Preprint
For detailed statistical derivations, empirical validation plots, and source code benchmarks, consult the full article manuscript:
Complete technical article detailing the metis package, cSEM benchmark, sign alignment algorithm, and R code snippets.
6. Academic Citations
- Hair, J. F., Hult, G. T. M., Ringle, C. M., & Sarstedt, M. (2022). A Primer on Partial Least Squares Structural Equation Modeling (PLS-SEM) (3rd ed.). Sage.
- Hair, J. F., Sarstedt, M., Ringle, C. M., & Gudergan, S. P. (2018). Advanced Issues in Partial Least Squares Structural Equation Modeling. Sage.
- Henseler, J., Ringle, C. M., & Sarstedt, M. (2016). Testing measurement invariance of composites using partial least squares. International Marketing Review, 33(3), 405–431.
- Rademaker, M. E., & Schuberth, F. (2020). cSEM: Composite-Based Structural Equation Modeling. R package.
- Ray, S., Danks, N. P., & Calero Valdez, A. (2021). SEMinR: Domain-specific language for building structural equation models in R. SSRN Working Paper.